

Lord Kelvin’s adage, “If you can not measure it, you can not improve it,” is intertwined with our lives on a daily basis in many different ways. Having a doctor measure your blood pressure, taking an exam in school, checking your tire pressure with a tire gauge, and tasting food to see if it needs more seasoning are all forms of measurement and assessment. Training athletes should be no different. As a matter of fact, we should take more in-depth assessments since we are dealing with human biology and physiology.

Figure 1. Student assessment in the classroom.
My motivation to become a coach came in 2000 after reading about some disturbing trends in the local high schools. Track and field athletes were sustaining significant injuries (broken femur in a cross country runner, anemia in three female runners, a torn hip flexor). My first task was to observe (subjective assessment) how these high schools were training their athletes. I visited four of them and noticed two primary issues. First, a majority of athletes at all four schools were wrapping their shins with ProWrap, indicating shin splints. Second, most of the athletes looked exhausted at the end of practice.
When you look at young people between the ages of 6 and 18 who participate in sports (38 million) and the number of injuries that occur (1 out of 10 = 3.8 million), you begin to see that something is drastically wrong. As these athletes become older (between 15-18), the severity of their injuries increases.

Figure 2. An estimated 3.8 million young anthletes are injured each year.
It became clear to me that a big missing link in the training process was the almost total lack of any real assessment process to determine each athlete’s individual strengths and weaknesses. Most testing back then was strength-based—for example, determining an estimated 1RM of the three standard lifts (squat, bench press, and power clean or deadlift). I never really saw any local track and field coaches timing their athletes’ sprints or intervals during practice to determine PRs, the number of reps, volume, or intensity. It was all very haphazard. Standard sport-specific endurance testing was all over the board and much of of it was irrelevant to the sport (including 3-mile runs for American football or 6-mile timed runs for basketball). Also, coaches never re-tested to see improvement (not that it would have mattered).
Theory into Practice
After identifying those two key problems in high school athletics (the high injury rate and lack of a standardized assessment process) I began putting my theories to the test in a practical setting at a local high school. I took over the off-season conditioning program for the entire football program (freshman through varsity). The first step in implementing my program was to structure a sound warmup that would prepare the athletes for training. They performed this warmup on the practice field or in the weight room. After that I had the upperclassmen do timed sprint on Mondays and Thursdays and the others on Tuesdays and Fridays. This allowed me to determine improvements. For the freshmen and sophomores, I established guidelines (strength assessments), and they had to meet certain strength standards—such as 25 good pushups and 10 chin-ups with strict form—before they could begin lifting barbell weights. Over the next three years I refined, changed, and updated this program as my knowledge grew, along with the athletes’ understanding of what was expected, and a culture began to be established.
1 in 10 young athletes are injured each year. Better assessments can reduce the injury risk. Share on XAfter three years of coaching at the high school level, I was ready to begin training athletes in my newly formed private fitness facility. During my research before opening it, I felt I needed a method of evaluating athletes prior to training to determine their readiness. I heard about the Omegawave system. It is a non-invasive tool that measures the cardiac system of the athlete through HRV (heart rate variability), the metabolic system (aerobic and anaerobic), and the central nervous system (CNS) through DC potential. In as little as four minutes, I could have actionable data.

Figure 3. Omegawave Sensor and iPhone App.
I knew this was something I needed so I could provide objective feedback on how the athletes were responding to the training. It would embody the message and culture I was trying to build: improving performance while protecting the health and well-being of the athlete. The Omegawave became a staple of our assessment program right from the start. We tested athletes before their first session, then carried out physical testing (short sprints, jumps, bounds, strength, endurance, etc.) for an overview of their relative strengths and weaknesses for their sport.
We also purchased an electronic timing system. Now we had three metrics (Omegawave testing, standardized physical testing, and speed timing) we could track to determine the athletes’ progress in their physical development.
Success Stories
Between 2003 and 2015, I have observed some outstanding long-term improvements among the athletes I worked with. For example, A.J. Glass, who began with me in 2009 as a high school freshman, improved his vertical jump from 24″ to 34.5″ in 2012 as a senior. His standing long jump improved from 8’1″ to 9’11”. A.J. now plays running back at Princeton University.

Figure 4. Long-term development chart of Vertical Jump for AJ Glass via Omegawave.
Another athlete I worked with was Owen Marecic, who started with me during his junior year of high school. When he began he weighed 210 pounds, had a 29″ vertical jump, squat of 335×1, bench press 240×1, and standing long jump of 8’2″. Six months later, Owen weighed 239 pounds, his vertical jump had increased to 36″ and his standing long jump to 9’11”, he squatted 365 pounds x 21 reps, and bench pressed 335×1. Owen played at Stanford University, where he won the inaugural Paul Hornung Award as the nation’s most versatile major college player. He had a three-year NFL career with the Cleveland Browns and San Francisco 49ers.

Figure 5. Owen Marecic HRV assessment via Omegawave.
A third example is Mike Petroff, a current high school football player. Mike started with me in 2010 as a 12-year-old weighing 131 pounds at 5’6″. His resting heart rate was 57 bpm, his vertical jump was 20.5″, and he ran the 40-yard dash in 5.3 seconds. Fast-forward to the summer of 2015. Mike is 6’1″, weighs 229 pounds, has a resting heart rate of 36 bpm, a vertical jump of 36.5″, and runs the 40-yard dash in 4.67.

Figure 6. Long-term development chart of Vertical Jump for Mike Petroff via Omegawave.

Figure 7. Mike Petroff HRV assessment via Omegawave.
The assessments I have used have stayed very consistent over the years, as I am trying to master the basics before investing in the next best thing on the internet. Currently I am testing three additional types of assessments on myself and hope to have them integrated into our set of metrics over the next 6-12 months.
Additional Assessment Methods
The first is the Moxy Monitor. Moxy uses light from the near-infrared wavelength spectrum (light from about 670 to 810 nm) to measure oxygenation levels in muscle tissue. Human tissue has a low optical absorbance of near-infrared light so the light can travel to reasonable depths. The near-infrared wavelength range is particularly useful because hemoglobin and myoglobin change color in that range, depending on whether or not they are carrying oxygen. To find out what your limiting factors are using the Moxy assessment, you first attach the device to working and sometimes non-working muscles. Through this assessment, which is relayed in real time to a computer or television screen, you see current heart rate, bike wattage via a trainer or running speed on a treadmill, along with Sm02 (muscle oxygenation/utilization) and tHB (blood flow/delivery).
To conduct a step test on a bike trainer using Moxy, you might do the first step at 100 watts for 4 minutes, a 1-minute rest, 100 watts again for 4 minutes, another 1-minute rest, and then increase the wattage to 120. The test is carried out over 5-6 steps in this manner. With the data being captured in real time during these steps and reaching failure at the end of the assessment, you get an accurate personalized picture regarding the limiting factor. In my case, here is a short recap from David Richter of Herriott Sport Performance in Seattle after my first bike-specific Moxy test.
You were limited by recruitment. If a muscle can’t utilize O2 any longer, the brain shuts down recruitment. You had available O2, but couldn’t use it. How do you use it? There’s a thing called the Dissociation Curve. It controls your bioavailability of O2. A rightward shift causes a decreased affinity for O2. This makes it difficult for hemoglobin to bind to O2. But it makes it easier for hemoglobin to release O2 bound to it. A leftward shift in the curve causes an increased affinity for O2…hemoglobin binds with O2 more easily. But it unloads more reluctantly. You need to move the curve to the right (to release O2)…only when you’re near maximum effort. Then back to the left (to pick up O2).
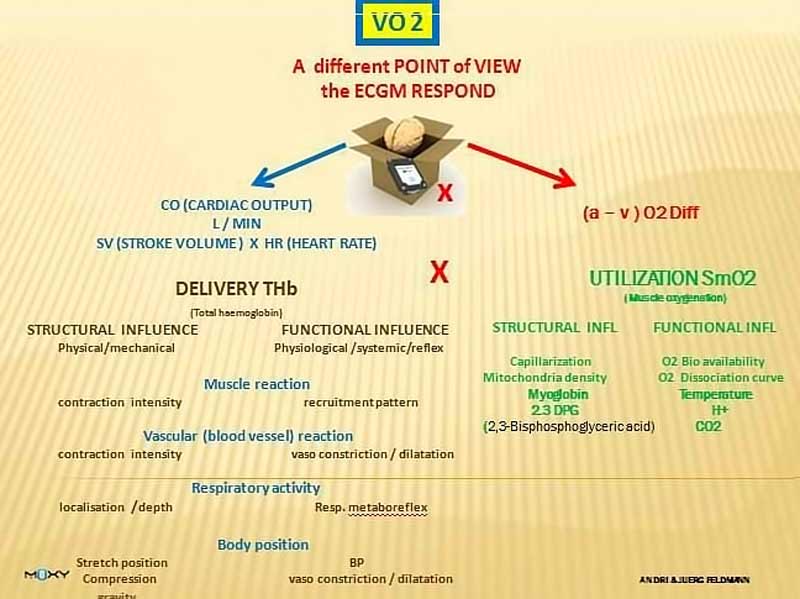
Figure 8. Moxy measures oxygenation levels in muscle tissue.
As you can see, the observations based on my initial assessment are far more detailed than just telling me I need to go out and ride longer/faster/harder. Here are the suggestions David gave me to begin improving my weak points.
Can you see the catch-22? It’s a shell game. It’s a game that is tough to control. It’s a game that is played by your brain, whether you like it, or not. But there are some things that you can do to take temporarily control of that curve. Breathing coordination is how you accomplish that…you can temporarily take charge of that curve by regulating CO2. An increase in CO2 results in a decrease in blood pH. But that’s where you play with fire. If you can’t get rid of that CO2, then you have a different problem.
Better breathing coordination will make you better…and help with recruitment.
The second assessment is the Misfit Flash, a fitness tracker and sleep monitor I use purely to monitor my sleep. It is a very inexpensive way to look at sleep quality and duration, which are important factors related to recuperation.

Figure 9. Misfit Flash used to monitor sleep.
Inside Tracker
The third assessment, which I just started in June, is blood analysis from InsideTracker. The company’s literature states that
InsideTracker is a personalized health analytics company founded by leading scientists, physicians, nutritionists and exercise physiologists from MIT, Harvard and Tufts University. The InsideTracker platform tracks and analyzes key biochemical and physiological markers and applies sophisticated algorithms and large scientific databases to determine personalized optimal zones for each marker. InsideTracker’s expert system offers science-driven nutrition and lifestyle interventions that empower people to optimize their markers. When optimized, these marker levels have been scientifically proven to increase vitality, improve performance and extend life.
Our goal is to empower individuals with the essential information they need to manage and optimize their health. We believe that by providing a dynamic, personalized analytic platform at the intersection of biology, science and technology, then distilling the results into simple, natural, and sustainable nutrition and lifestyle recommendations to follow, we can help people live longer, healthier lives.
The information InsideTracker provided after my initial assessment was excellent, because I now had a point from which to begin. InsideTracker categorizes your results as high, normal, optimal, and low. After looking at the 30 biomarkers I had tested and speaking with Carl Valle and another highly respected colleague, I began with the low-hanging fruit. The three biomarkers I set out to attack first were vitamin D, testosterone, and blood glucose.
Figure 10. InsideTracker Testosterone test results.
My vitamin D level was 36 ng/ml, and for my age InsideTracker recommends optimal levels at 40-48. So my first task was increasing my vitamin D supplementation to 10,000 IU per day (previousIy I was only taking 4,000). The next marker was my testosterone level, which at 302 ng/dl was low for my age. Optimal levels prescribed by InsideTracker are between 419-1179. To begin addressing this issue, I focused on improving my sleep quality with basic and actionable steps (no phone/tablets/computer 2 hours prior to bed, 1 hour prior begin to read a book, have set sleep/waking times, and supplementation with 30mg of zinc before bed).
Figure 11. InsideTracker Vitamin D test results.
The final piece needing work was my blood glucose. After the first assessment, I was at 88mg/dl. Analyzing my nutrition prior to this, I realized I was not getting adequate fiber in my diet. I focused on getting at least 40g of fiber per day through foods such as oranges, blackberries, raspberries, Fiber One cereal, and whole grain bread. I eliminated any gels/bars I might eat during a long bike ride. This was one of the few tests that I had re-tested through my doctor and after a month it dropped down to 78mg/dl, which was now in my optimal zone of 65-83. Within the next month, I will be getting a re-test to see how the changes in lifestyle and nutrition have affected my biomarkers.
Figure 12. InsideTracker Glucose test results.
Please share this article so others may benefit.
[mashshare]