By Marco Pozzo, M.S., CEO of SmartCoach Europe AB
A famous advertisement once stated, “power is nothing without control.” With a wider meaning, this concept can be applied to performance monitoring in sport: what cannot be measured and quantified cannot be improved. This is the reason in the last decades the sports market bloomed with a countless number of gizmos to measure any possible performance parameter including heart rate, speed, agility, force, muscle stiffness, power and so on.
These devices can be substantially divided into two great families: those to assess aerobic performance ranging from GPS to heart rate meters, speed radars, lactate and oxygen uptake meters, etc., and those devoted to strength assessment. In this article, we will focus on this latter category, restricting our review to the equipment targeted for professional use.
Back to Basics
Before talking about technology, let’s review some basic but fundamental concepts of physics and mechanics. Few mechanical variables contribute to determining performance in sports: speed, acceleration, force and power. They are related to each other by the fundamental Newton’s laws and, obviously, they describe the athlete’s performance on a more general level than its sole resistance characteristics. Any other parameter such as agility, endurance, and more exotic ones are indexes that can be defined and computed upon those basic variables.
The first fallacy to debunk is that mass is not force. For how much as this might seem splitting hair, this distinction is not just formal since the former is the cause of the latter, and expressions such as “a force of 10kg” are conceptually erroneous. Mass is a physical property of a body, related to its composition and size (the number and type of particles it is composed of). A barbell will have the same mass (e.g. 10kg) on Earth, on the Moon or in outer space. However, the gravitational pull exerted on its mass will generate a downward force (the weight) described, in general, by this fundamental law:
Force (F) = Mass (M) x acceleration (a) [1]
where mass is measured in kg, acceleration in m/s2 and force in Newtons (N). When disembarking from the Apollo 11 lunar module in 1969, Neil Armstrong experienced less weight despite his mass was unchanged because gravity acceleration is lower on the Moon.
So, one possible definition of force is the capacity of accelerating a mass: 1N is the amount of force necessary to exert an acceleration of 1m/s2 on a 1kg mass. In Imperial units, that would translate into: 0.2248lbf (“pounds force”) is the force necessary to exert an acceleration of 3.2808ft/s2 on a mass of 2.205lbs, which is somewhat messier and justifies why the metric system is more straightforward in performance assessment. However, it’s merely a matter of conversion factors (1kg = 2.205lbs, and 1m = 3.281ft).
The definition of acceleration is more obvious. Acceleration is the rate of change of speed over time (mathematically speaking, it’s its time derivative). An acceleration of 1m/s2 means that, each second, speed increases by 1m/s (3.281ft/s).
The formula [1] has general validity for movements in any direction such in the case of a football player thrusting a ball, a sprint or change of direction. A larger mass requires more force (e.g. more reaction force exchanged with the ground) to achieve a given acceleration. Mass is the characteristic of a body which defines its inertia, i.e. its tendency to remain in its current state of motion (still or moving at constant speed, like an object floating or drifting in space not subjected to any force). The bigger the body mass, the larger its inertia to oppose to acceleration.
Of course, that in formula [1] is the total acceleration. In weight lifting we can highlight the gravitational component and rewrite [1] as follows:
F = M x (g + a) = M x g + M x a [2]
where total acceleration (g + a) is composed by two components: the constant, gravitational pull g (9.81m/s2) and the actual acceleration (change of speed) a generated by the athlete. The force M x g is the weight and is constant (10kg = 98.1N on Earth). The additional component M x a is variable and is greater if the movement is more explosive. This to a less obvious conclusion. Even in the simplest and most linear weight lifting exercise, mechanical force is not constant and not equal to weight because of this inertial component. This observation justifies the usefulness of objective measurements.
The second and even more paramount parameter is power, which is measured in Watts (W) and is calculated as follows:
Power (P) = Force (F) x speed (v) [3]
Hence, power by itself summarizes the two other fundamental variables and determines the capability of expressing force at high speed. It is possible to demonstrate an alternate and equivalent definition:
Power (P) = Energy (E) / Time (t) [4]
where E is the energy or work expressed in Joules (J). So, power is also the capacity of developing energy (work) in a shorter time.
That is why power is the ultimate variable dictating the athlete’s performance. Of course, speed plays a major role too – it tells how fast the athlete can move – and its derived variable, acceleration, is an indicator of the capability of sprinting and changing direction quickly. But paradoxically, force per se is not the determinant of performance if it cannot be expressed at high speed. That’s why isometric exercises (pushing against a fixed obstacle) are seldom if ever used in performance training. And that’s why power measurement is crucial in performance assessment.
Spinning Wheels
In the 80’s, two brilliant Swedish researchers, Per Tesch and Hans Berg from Karolinska Institute in Stockholm, were asked to develop a strength training device which could work in absence of gravity, to be used by astronauts to combat muscle atrophy induced by permanence in space. They came out with the idea of using a flywheel spun by a strap winded onto its axis. This methodology proved to be effective in eccentric training and has been extensively validated. The rest is history, and since then many companies began manufacturing flywheel devices – such as the popular VersaPulley (USA) and kBox (Sweden) – adopted by numerous top athletes and teams.
In this type of devices, physics involves rotational instead of linear movements, but the underlying working principle is the same, with the following formula:
Torque (T) = Inertia (I) x angular acceleration (α) [5]
This formula is identical to [1] with rotational variables instead of linear ones: torque (Newtons per meter, Nm) instead of force, angular speed and acceleration instead of their linear counterparts, and moment of inertia (I, measured in kgm2) instead of mass. The moment of inertia is for rotational movement what mass is in linear movements. It expresses the inertia of a body to remain in its state of motion (still or rotating at constant speed). Because of the analogy between linear and rotational movement, the moment of inertia is also called angular mass. For brevity, we will refer to it with its common abbreviation “inertia” despite being a misnomer.
As for mass, the moment of inertia is a physical property of the flywheel that depends on its material and geometry (density, thickness, and flywheel diameter). To increase it, additional rotating masses are added or more flywheels are stacked onto each other.
Equivalently, power is computed in a similar way (compare with [3]):
Power (P) = Torque (T) x angular speed (ω) [6]
Linear variables, such as force and speed, are derived respectively from torque and rotational speed with the axis radius as the proportionality factor:
Force (F) = Torque (T) / radius (r) [7]
speed (v) = angular speed (ω) x radius (r) [8]
The main difference with respect to weight lifting is that force does not have a constant gravitational component (M x g), so in these devices the resistance is truly and merely proportional to acceleration. As opposed to weights, power and force can vary radically depending on the execution speed and technique, even with the same resistance (same inertia). Even the mildest force can spin the heaviest flywheel although the movement would be excruciating slow. Without the possibility to measure these variables, the strength coach cannot know the athlete’s performance. Whether eccentric overload is produced or not, or if its amount is excessive and potentially dangerous, making a measuring tool absolutely paramount for this type of training methodology.
The Origins
Among the precursors of objective performance monitoring in sport, Carmelo Bosco deserves special mention. He was the first to develop and put into the market a sensor and a real-time system to provide optical and acoustic feedback to the athlete. The device had three lights that indicated if the variable under observation was below, within or above a preset target.
Other commercial devices followed, using linear encoders to measure the lifting speed in weight training, some of them with output to PC analysis software, some other with mere numerical indication on a display. Currently, it is possible to choose among a dozen different systems, each one with its peculiar features.
The Technology
Looking at the previous formulas [1] and [2], it can be noted that since the lifted load (M) is known, it is sufficient to measure speed or acceleration to derive all the other variables (i.e. force and power).
The most used methodology relies on a linear encoder, i.e. a sensor with a spring-loaded, fine steel wire hooked to the barbell or weight stack that measures the lifting speed. Acceleration is computed from speed and is used in formula [1] to calculate force. Force is in turn used to compute power using formula [2]. So, although they allow measuring all the training variables, these devices are actually speed meters: they directly measure speed and obtain all the other parameters by calculation.
An alternate method is to use an accelerometer mounted on the weight. The principle is similar but, in this case, the variable measured directly is acceleration, which is used to compute speed using a process called integration (cumulative sum). Once speed and acceleration are known, the other variables are calculated again using formulas [1] and [2]. The main advantage of accelerometers is that they are cheaper, more compact and do not require a wire to be hooked to the weight. Unfortunately, the process of computing speed from acceleration is biased by intrinsic limitations (measurement noise and drifts that cumulate during integration) yielding less accurate results at low speeds (i.e. when lifting heavy loads). This is why linear encoders are preferred for precise assessments such as power tests (see later), where speed ranges from high to very low.
For flywheel devices, the principle is similar but relies on the measurement of the flywheel’s rotational speed. This is done by a sensor such as a photocell that detects the holes on a slotted disk mounted on the flywheel shaft. For technical reasons, it is more practical if such sensor is factory installed.
The What and Why of SmartCoach
In 2006, I was working at the Department of Exercise Physiology of Karolinska Institute as a fellow researcher for the European Space Agency to validate the use of flywheel devices in space. A Spanish researcher and strength coach, Julio Tous, came to investigate the applications of flywheel training in sport, after successfully using this methodology at Barcelona Football Club. From his user perspective, he pointed out a gap in the market. Back then there was no performance monitoring tool sufficiently sophisticated for research environment, yet practical enough for daily training of individual athletes and teams and which could adapt to any training device ranging from conventional weights to flywheel training devices. The seed for SmartCoach was planted.
Now SmartCoach is an open, scalable range of products consisting of data acquisition hardware and planning/analysis software tools which are constantly updated by working elbow to elbow with professional strength coaches to understand their needs, collect their invaluable feedback and turn it into new features. SmartCoach has a powerful software editor to create training schedules. It provides an intuitive, real-time feedback during the exercise to guide the athlete in reaching the prescribed target while data is automatically recorded and offers a number of analysis tools to assess and monitor performance once the training session is over.
Although several similar tools exist on the market, they have one more more of the following limitations:
- some only work with weights;
- others are dedicated only to a specific brand of flywheel devices;
- some others provide feedback but do not allow recording data;
- many do not have all the performance analysis features offered by SmartCoach;
- most do not feature a training schedule planner;
- and none has a comprehensive solution for professional team performance monitoring such as SmartCoach Pro.
One of the added values of SmartCoach is that of allowing both training schedule planning and performance assessment with one single, powerful yet user friendly software which is cross-compatible with the widest (and continuously growing) range of training devices from different manufacturers. This does not force the customer into sticking to a specific brand or machine only, which seldom if ever covers all the different needs in training. The SmartCoach linear encoder (Power Encoder) is useable with any weight stack machine or free weights (barbells, dumbbells, etc.). Two of the most popular flywheel machines (VersaPulley and kBox) come with a preinstalled speed sensor specifically designed for use with SmartCoach, but we provide solutions for other brands, too. In addition, SmartCoach is also compatible with Exentrix – a revolutionary active, intelligent training device which uses a computer-controlled electric motor to provide resistance. Finally, there are two suites for release in fall 2015 for monitoring Pilates spring-loaded training beds and the popular Keiser devices with pneumatic resistance. SmartCoach is also the perfect solution for those who are into weight training but might consider expanding towards flywheel devices in the future.
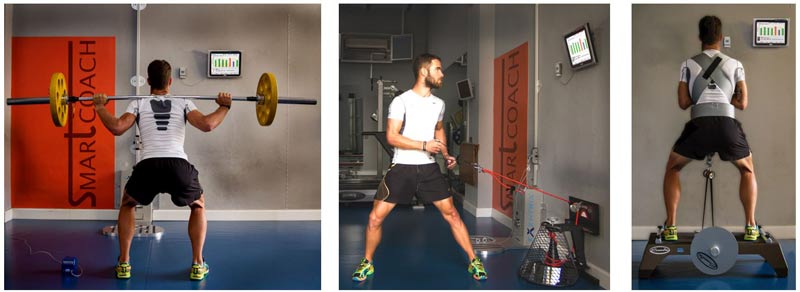
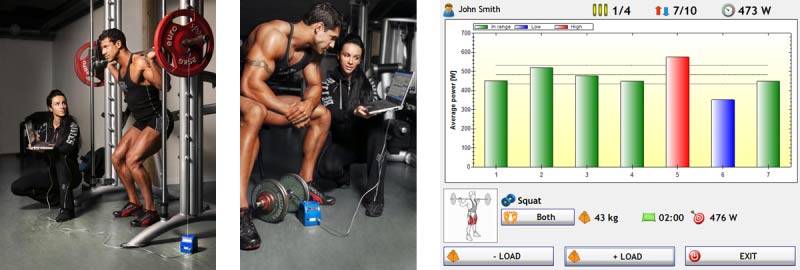
Figure 1. SmartCoach used with free weights and flywheel training devices and feedback given on the SmartCoach Pad. Left: the blue box on the floor is the Power Encoder used to measure speed, force and power in weight lifting exercises.
One Size Does Not Fit All
To better adapt to the needs of different customer profiles, the software is modular, i.e. related functions are grouped into distinct modules that can be purchased and activated separately. This allows starting from a more basic and budget-wise version of the software and progressively up-scaling to more sophisticated features as the needs arise.
Furthermore, three different types of acquisition hardware are available (Figure 2). The Power Encoder is a universal device for both weight and flywheel training and is composed of a linear encoder with an additional dedicated input to connect to compatible flywheel devices. The Weight Encoder is a budget solution for those only interested in weights (linear encoder only), and the SmartCoach Lite is a dedicated acquisition device for flywheel machines only.
Software and hardware are offered in convenient ready-made “packs” with different hardware and with different sets of software modules, from basic to more advanced. For example, both the Performance and Performance+ packs include the functions to work with weights and flywheel devices, but the latter includes additional premium software modules for more advanced analysis. The Fitness and Fitness+ are devoted to weights only; and so on. The Planner is the cheapest pack, composed of software only, to be used for planning and logging exercise but without actual recording. The Platinum is a premium pack including all the features, lifetime unlimited free software updates and additional services such as a license insurance which offers free reinstallation in case of catastrophic events (loss or theft of the computer, hard-disk failure, etc).
It is possible to customize a solution by purchasing a standard pack plus some additional modules, or building a combination of desired modules from scratch. It is also possible to purchase additional modules at any time to upgrade the software.
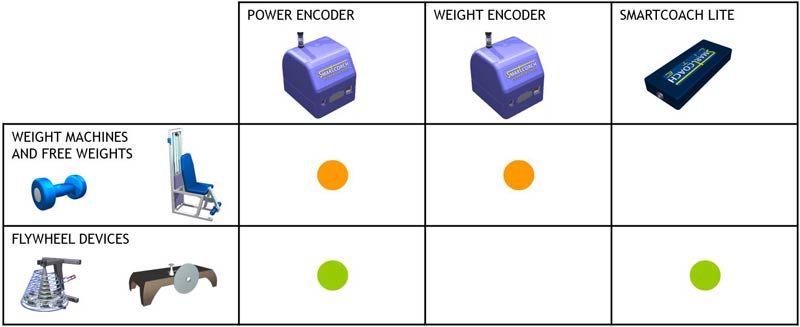
Figure 2. The SmartCoach universe: different hardware and software solutions for different types of training devices.
Aiming at the Peak
Muscle force decreases with speed and vice versa – the heavier the load, the lower lifting speed will be. Since power is force times speed (formula [3]), light loads will produce high speed but low force, hence little power. Conversely, heavy loads will produce intense forces but very low speeds, therefore, low power. The optimal trade-off is an intermediate load which produces enough force and speed so that their product – power – is maximized. But how it’s possible to find out that load?
One of the key features of professional monitoring tools like SmartCoach is the possibility of assessing the athlete’s status and fine tune his training load. The most objective method is to do it by periodically executing a so-called “power test”. Power tests are exactly aimed at assessing the power vs. load and power vs. speed relationships (Figure 3). On the power vs. load curve, the load corresponding to its vertex is the one that ensures maximum power output, while the power vs. speed curve tells the optimal execution speed – pretty much like an engine’s power curve indicates the rotation regimen at which the engine performs best.
A power test is easily done in SmartCoach. A minimum of three sets (four are recommended) with different test loads are required, in which the subject is asked to perform a few reps for each load at the maximum possible speed. From that data, power curves are automatically calculated to be used, if desired, to individualize the training load. From the comparison of periodical training loads, it is also possible to assess the athlete’s improvement or recovery: whether he has improved his power output (upwards shift of the curve), his capability of producing power at higher speeds (rightwards shift of power vs. speed curve), or both. It is also possible to compare left vs. right limb performing unilateral exercises.
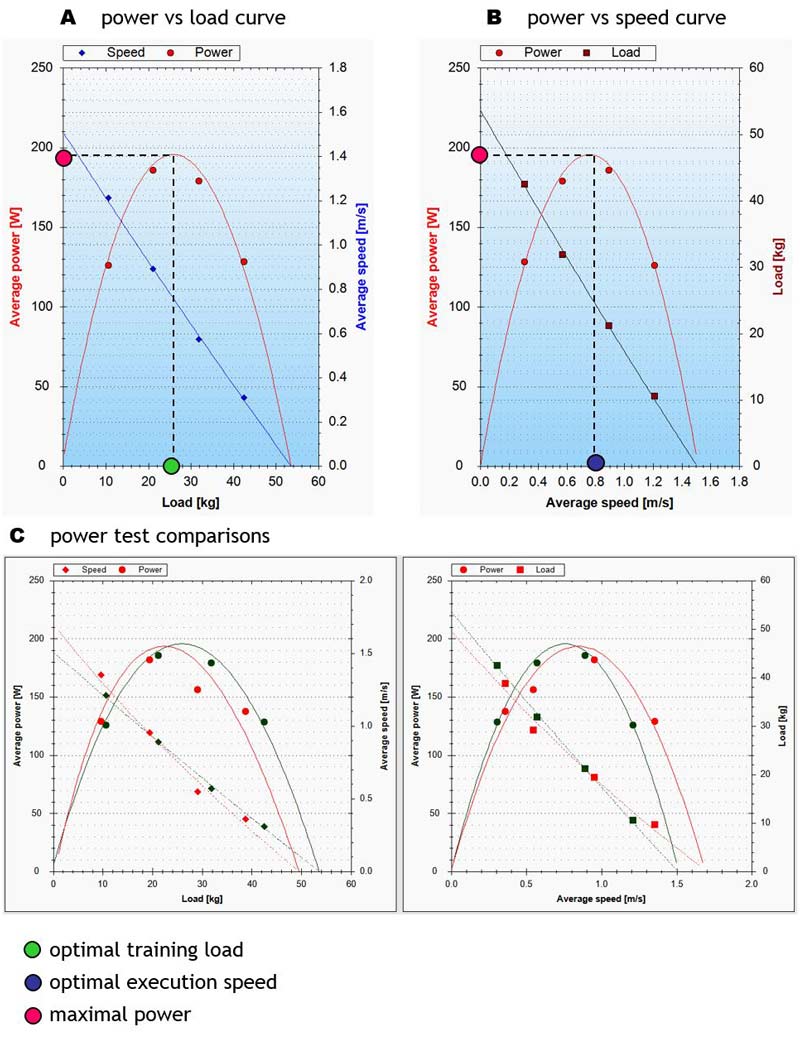
Figure 3. Results of a power test: A. Power vs training load, B. Power vs execution speed, C. Comparison of two power tests in different dates. A summary table indicates the absolute and relative improvements in peak power, optimal load and speed.
To achieve most reliable results, power tests shall be done with test loads spanning the widest possible range of values (relatively to the athlete’s capability). One possible sound method is to express loads as % of 1RM (one repetition max, i.e. the load which he can lift once but not twice) and use roughly equally spaced test loads, for example around 20, 40, 60 and 80% of 1RM.
1RM is, therefore, another useful performance parameter and, if assessed by definition, it would expose the athlete to his maximal load with possible risk of injury. In addition, a true 1RM test would be excessively time consuming and biased by the developing fatigue as the load is increased. With SmartCoach, it is possible to run a quick and safe 1RM test by simply counting the reps to failure using a sub-maximal load and letting the software estimate 1RM from formulas validated in the scientific literature. Results can be logged to assess the change of 1RM over time.
Needless to say, SmartCoach also allows the executions of power test with flywheel devices, answering to the typical one-million dollar question: “since flywheels are variable resistance devices, which is the optimal training inertia?”
Individualizing the Training Load
Time constraints when working with large groups of athletes seldom, if ever, allow optimizing the training schedule for each individual. This aspect has been particularly taken care of in SmartCoach because adjusting the target power (with respect to peak power, Pmax), training load and number of reps allows aiming at different needs that may arise: improvement of peak power, augmented endurance, hypertrophy, etc. For example in a field sport it would be desirable to improve power without hypertrophy because the augmented mass would diminish the acceleration in changes of direction. In other cases hypertrophy is desired to strengthen specific muscle groups, and so on.
SmartCoach offers a unique power-curve based planning to easily tune the work point (target power and load) by displaying it in a graphical way as a yellow square directly on the most recent power curve (see zoom on Figure 4A). As shown in Figure 4C, for any sub-maximal power level (PT, dashed-dotted line) there are two optimal training loads (L1 and L2, dashed lines). The lower one results in higher speed and the higher one produces less speed but more force.
In Figure 4A, the target has been set at 85% of Pmax and the load has been manually selected as 42kg (red framed parameters). SmartCoach can tell that this combination cannot be achieved by the athlete since the working point (yellow square) falls outside his power curve. It is also possible to let SmartCoach automatically calculate the training load for a desired target power (Figure 4B, green framed parameters) by just choosing on which side of the power curve to work: left (more speed) or right (more force).
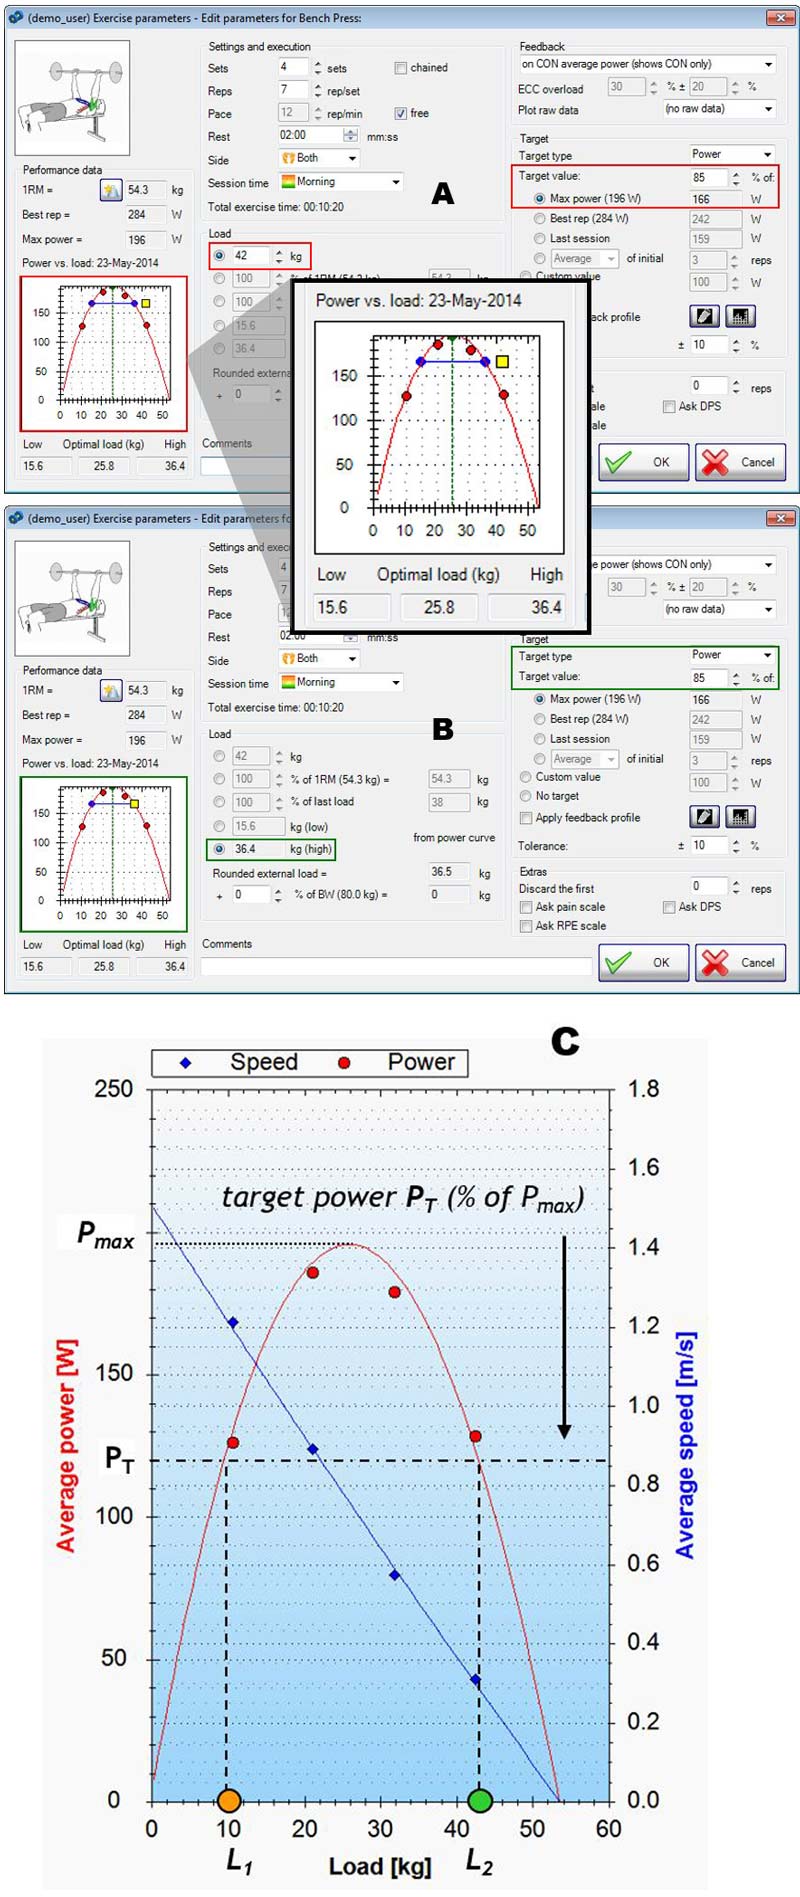
Figure 4. Individualizing the training schedule with SmartCoach: A. manually selecting target power and load; SmartCoach indicates if the combination (yellow square) is consistent or not (as in this case) with the athlete depending whether the work point falls within his power curve; B. letting SmartCoach calculate automatically the load for a desired power output; C. estimation of optimal loads at sub-maximal power output (PT): except when working at 100% of maximal power, two loads (L1, L2) allow the same power outcome but with different trade-offs between speed and force.
Another unique feature allows creating a training schedule for one player (one or more sessions spanning single or multiple days) and propagate it to an entire group or team in few clicks. By expressing the work point in relative terms (e.g. power as percentage of max power, average or best of the N initial reps, etc.) SmartCoach will paste the same schedule to each athlete, individualizing the actual target power and load by recalculating them based on each athlete’s power curve.
The training schedule editor includes many other powerful functions such as creation, export and import of circuits and template protocols; easy creation of sets with different parameters (increasing/decreasing load and/or number of reps, alternate side, Figure 5A), and even a variable profile editor to express a different threshold for each repetition (Figure 5B). This feature is useful to get training closer to the situation in the pitch. Whereas movements are different from each other while in the gym the athlete performs identical repetitions. It is then possible to define profiles with random patterns to train the subject’s capability of modulating power (e.g. from a powerful sprint to a high-precision task such as a tackle in soccer), challenge his ability to react to unexpected demands, or periodically repeat powerful actions and test his so-called Repeated Power Ability (RPA).
SmartCoach also offers the possibility of defining one’s exercises with customized name and icon. Training schedules can also include non-strength exercises such as treadmills, cycle ergometers, vibration platforms, core stability exercises and any other types. In this case, no data is recorded but the execution can be logged with its execution date, duration and parameters (also customizable), making the software an integrated environment that covers the broadest training needs. Schedules can also be printed on hardcopy or as PDF files with optional custom logo.
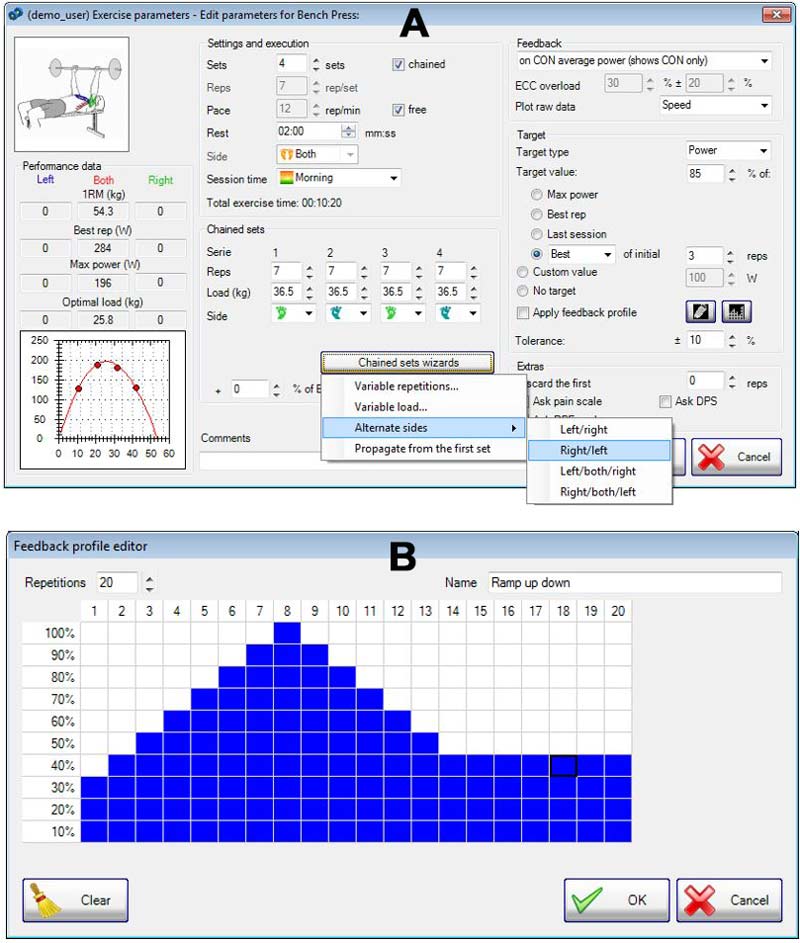
Figure 5. Examples of some advanced features in exercise planning: A. wizards to create sets with different reps, load and/or alternate sides; B. profile editor, allowing designing patterns with a different target power or speed for each repetition. Other features include a metronome to pace the execution, a calculator to estimate the duration of each set, exercise, and entire session, and so on.
Assisted Training
One of the most paramount features of SmartCoach is its real-time feedback, i.e. the capability of guiding the athlete in reaching the prescribed target power or speed by means of intuitive visual and acoustic indication. During exercise, a graph is shown with a bar representing the attained power or speed for each repetition. If the parameter falls within the given threshold and tolerance, the repetition is marked in green; if excessive in red, and if insufficient in blue (Figure 6).
Several options allow choosing the feedback parameter (speed or power), the phase to be controlled (concentric or eccentric), the value (peak or averaged over the entire phase), or displaying both phases with twin bars.. Additionally, SmartCoach is the only system featuring a unique feedback on eccentric overload. In this mode, the color represents the ratio between eccentric and concentric rather than absolute power (blue = insufficient overload, red = excessive, etc.).
Advanced features allow showing raw data from the last repetition to check the execution in greater detail, and one of them offers a feedback in the propulsive phase: in this mode, the concentric phase is further divided into the acceleration (propulsive phase) and braking actions. If the propulsive phase is too high with respect to the average of the entire concentric phase, this is an indication of poor execution (overreaching) and/or excessively low load for the power capability of the subject, as he “throws” the load at the beginning of the concentric phase (high propulsive power) and then has to compensate with an intense braking action towards the end of lifting, resulting in waste of metabolic energy for a given power output.
Regardless of which parameter you choose as feedback, all the variables are stored (including raw data) for further analysis at the end of the training session. The feedback also indicates the number of sets and reps to go, and a countdown appears at the end of each set showing the recovery time. Optionally, it is possible to ask subjective indexes of pain and fatigue at the end of the last set, which are also stored along with training variables.
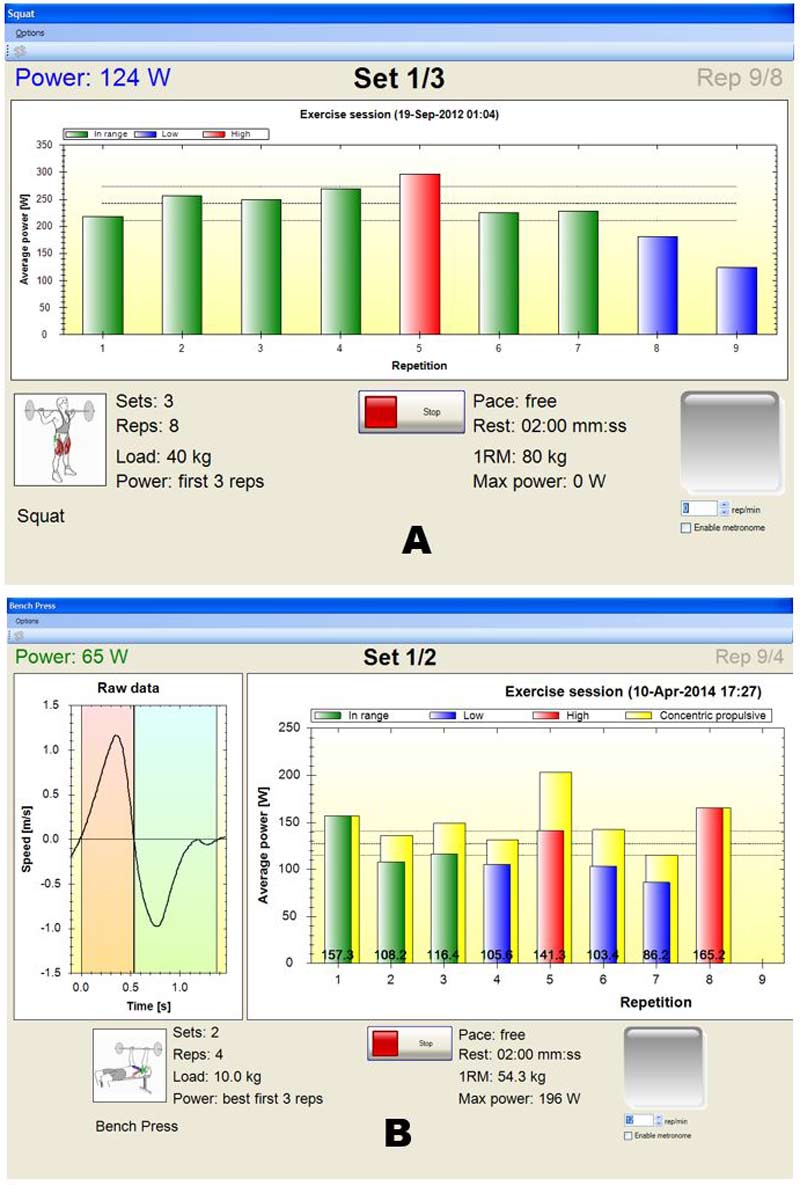
Figure 6. Real-time feedback during exercise: A: basic feedback with only one phase (e.g. concentric) controlled and displayed; B. advanced feedback with twin bars (concentric/eccentric or total/propulsive) and optional raw data (power, speed, displacement etc) of last repetition split into concentric and eccentric.
Drilling Down the Data
Once the training session is over, results can be immediately assessed on intuitive graphs showing the time course of performance variables during the training period (Figure 7A). A tree allows browsing through the various exercises, and progress can be checked with a simple glance. Trend lines display the time course of the average values for each session while vertical standard error bars show the intra-session variability of each parameter (wider bars = less consistent performance between reps). For each graph, numerical indexes tell the absolute and relative change, the change per week and so on.
It is possible to restrict the analysis to a specific period and range of loads (e.g. between 70% and 90% of 1RM to avoid mixing sessions with different purpose), check the values of individual reps and discard unwanted ones, export data to Excel for an entire range of dates and group of subjects, analyze raw data, copy and paste the graphs into an athlete’s report and, print a detailed progress report.
Another feature allows analyzing the athlete’s imbalance and its evolution over time. By choosing the desired exercise and load or inertia, SmartCoach will plot all the data from matched unilateral exercises (left and right limb recorded on the same days) as well as the imbalance index (Figure 7, B and C). Among the performance variable, there is also the total and average work per set, i.e. the mechanical energy expressed in Joules (J) or kilocalories (kcal) which is a very sound means to measure the training volume.
Results can be expressed as absolute as well as normalized data with respect to body weight (e.g. power in W/kg). Physiotherapists can also define “functional thresholds” to check when normalized power returns above a given threshold, e.g. to use it as an objective index of completed recovery from injury.
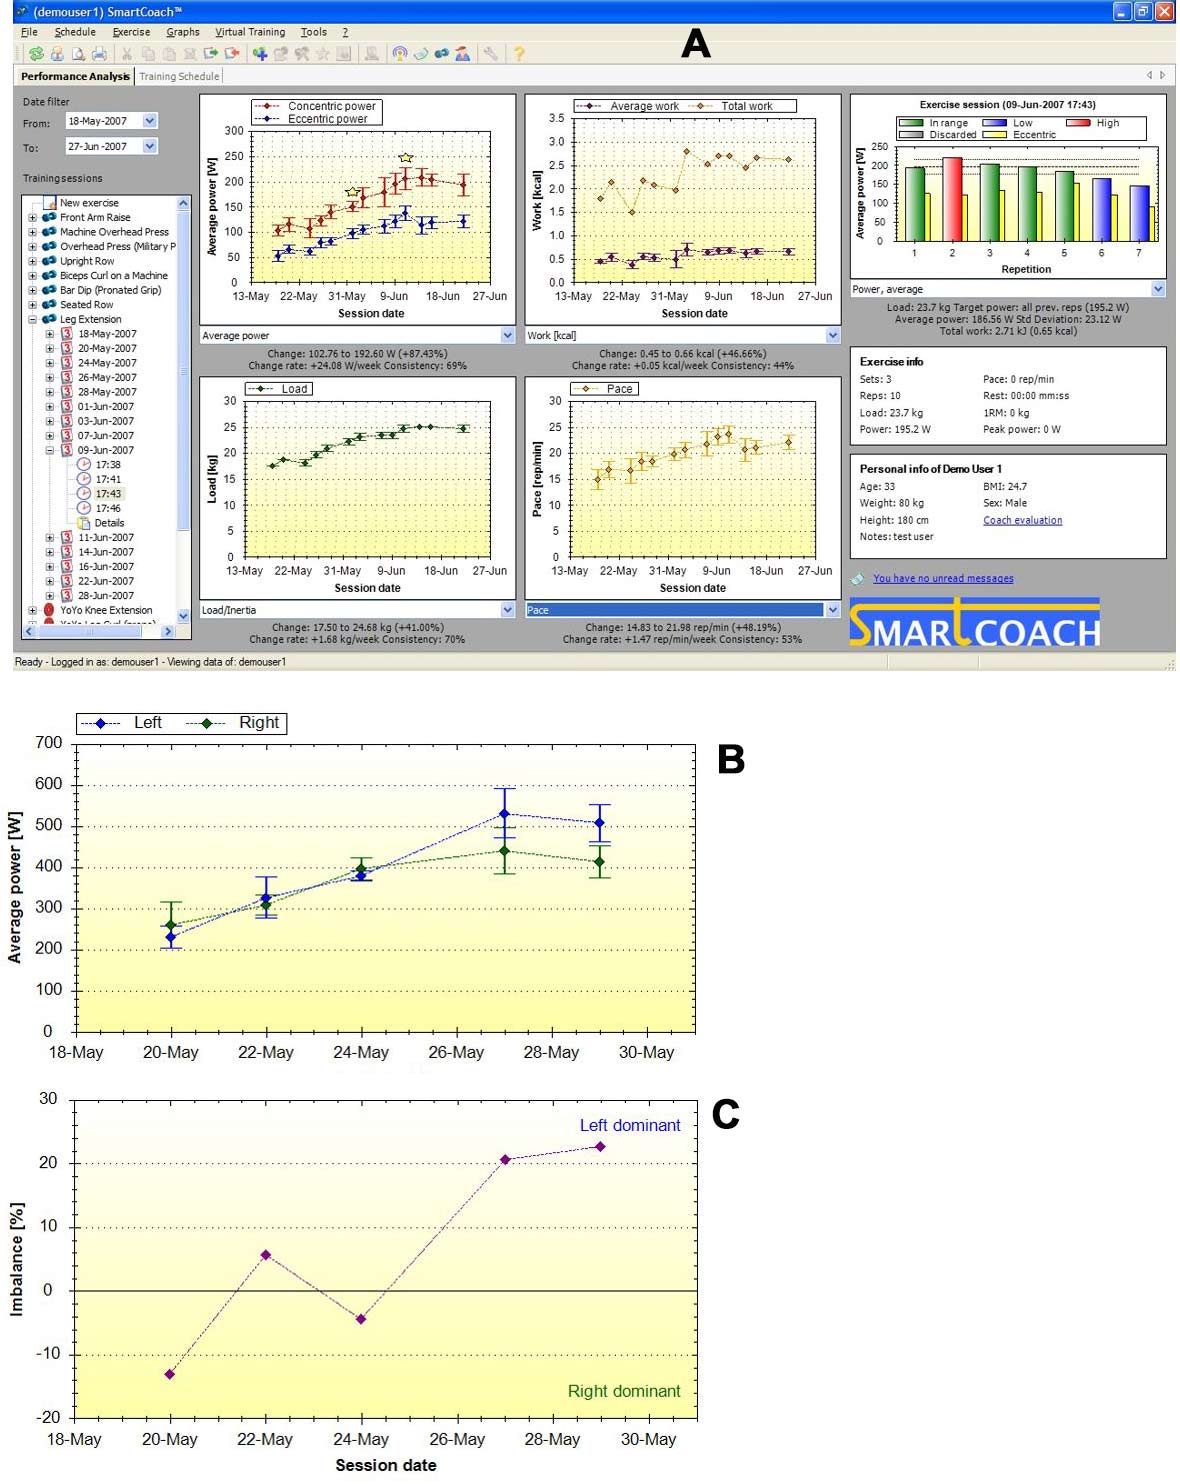
Figure 7. A. the Training Analysis pane showing progress graphs of all the training variables as well as individual rep values; B. progress graphs of matched unilateral exercises (same load and day); C. imbalance index over time.
Coaching Without Boundaries
SmartCoach offers one additional unique feature: remote coaching. With this function, a coach can remotely prescribe exercises for, and analyze training data of, one or more athletes anywhere in the world through the SmartCoach Cloud.
The working principle is extremely straightforward. The coach creates training schedules for his athletes on the SmartCoach software on his computer, then clicks a button to upload them to the cloud. When each athlete logs into his copy of SmartCoach, the schedule is retrieved and downloaded to his computer so that he can train with the remotely prescribed exercises. Likewise, after the training session is over, training data is uploaded to the cloud until the coach connects and downloads it. The coach can then analyze the results and, if needed, tune the schedule for the next training sessions. In other words, the remote coach has full and transparent access to the athlete’s training schedule and exercise data.
Since the data stream passes through intermediate storage on the cloud, this mechanism does not require the contemporary connection of athlete and trainer, which can therefore even be in different time zones or work during different hours. It also works if there is no internet connection while training, since the upload/download can be done later when a network is available again (just like sending and receiving emails). The system has been initially developed to demonstrate the feasibility of remotely coaching astronauts training onboard the International Space Station through the internet connection with Ground Control.
Remote coaching also includes a simple messenger to exchange general notes, as well as a tool to annotate graphs (for example, to highlight a particular trend or behavior). One trainer can coach from remote more than one athlete, and several trainers can coach each athlete. Applications include the sale of remote personal coaching services and follow-up of a team on a training camp or athletes training at home during the off-season.
Get Pro – The Team Solution
To complete the scenario, the SmartCoach range of products includes a system specifically designed for teams or numerous groups of athletes: SmartCoach Pro. It consists of a centralized system where each of several training stations is equipped with a feedback device (the SmartCoach Pad, a 15” touchscreen monitor) and acquisition hardware (Figure 8).
One central computer (server) stores the central database and is connected via cable or WiFi to all the Pads. It is used with a dedicated version of the SmartCoach software as the main workplace to create training schedules, analyze training data and produce reports. Optional additional workplaces (clients) can be used by other coaches to work in parallel. Clients can also be portable touchscreen computers to be brought to the gym to monitor the training in real time, make last-second adjustments, and so on.
One of the main advantages of SmartCoach Pro is the capability to record data simultaneously and independently from several subjects. Multiple athletes can train at the same time with feedback and all of their data logged. Athletes are equipped with a contactless identification wristband or card to log into any of the training stations. When approaching it to the reader, their training schedule is shown on an intuitive interface. As they start exercising, the feedback is shown to guide them to their prescribed target. Data is automatically recorded and stored in the central database for later analysis by the strength and conditioning coaches or physiotherapists.
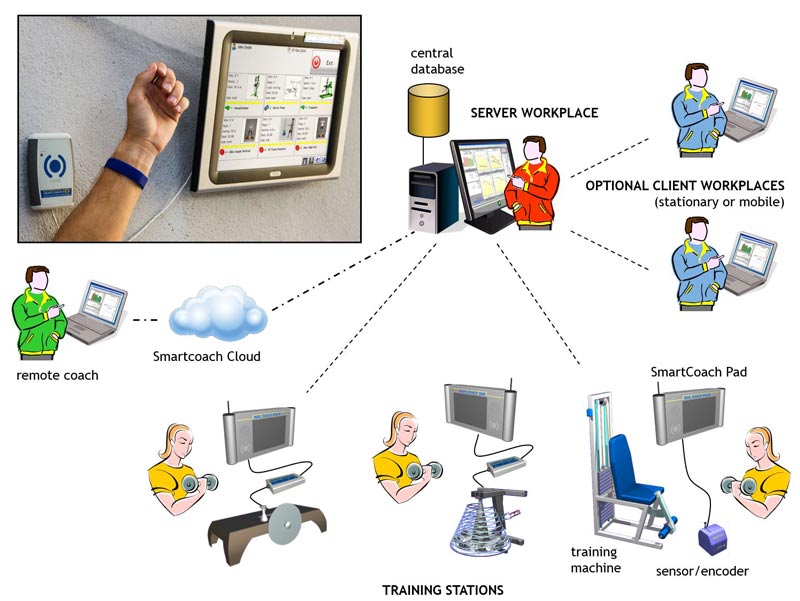
Figure 8. The architecture of a generic SmartCoach Pro system. In the inset: the SmartCoach Pad showing the training schedule and the contactless identification wristband/card reader.
Thanks to its high automation and user-friendliness, the use of SmartCoach Pro does not introduce overhead. Therefore, it permits exercising with objective feedback while recording each and every training session without distracting the coach with the burden of acquiring data, saving files, etc. The coach can then focus on checking the athlete’s execution and comfortably analyze the results at the end of the session. Remote coaching also works with Pro systems, potentially allowing the training of an entire team’s training ground from anywhere in the world.
Please share this article so others may benefit.
[mashshare]References
Berg HE, Tesch A. A gravity-independent ergometer to be used for resistance training in space. Aviat Space Environ Med. 1994 Aug;65(8):752-6
Bosco C, Komi PV, Tihanyi J, Fekete G, Apor P. Mechanical power test and fiber composition of human leg extensor muscles. Eur J Appl Physiol Occup Physiol. 1983;51(1):129-35
Bosco C, Belli A, Astrua M, Tihanyi J, Pozzo R, Kellis S, Tsarpela O, Foti C, Manno R, Tranquilli C. A dynamometer for evaluation of dynamic muscle work. Eur J Appl Physiol Occup Physiol. 1995;70(5):379-86
de Hoyo M, Pozzo M, Sañudo B, Carrasco L, Gonzalo-Skok O, Domínguez-Cobo S, Morán-Camacho E. Effects of a 10-week in-season eccentric-overload training program on muscle-injury prevention and performance in junior elite soccer players. Int J Sports Physiol Perform. 2015 Jan;10(1):46-52
Fernandez-Gonzalo R, Lundberg TR, Alvarez-Alvarez L, de Paz JA. Muscle damage responses and adaptations to eccentric-overload resistance exercise in men and women. Eur J Appl Physiol. 2014 May;114(5):1075-84
Moras G, Rodríguez-Jiménez S, Busquets A, Tous-Fajardo J, Pozzo M, Mujika I. A metronome for controlling the mean velocity during the bench press exercise; J Strength Cond Res. 2009 May; 23(3):926-31
Norrbrand L, Pozzo M, Tesch PA. Flywheel resistance training calls for greater eccentric muscle activation than weight training. Eur J Appl Physiol. 2010 Nov;110(5):997-1005. doi: 10.1007/s00421-010-1575-7
Tesch PA, Pozzo M, Ainegren M, Swarén M, Linnehan RM. Cardiovascular responses to rowing on a novel ergometer designed for both resistance and aerobic training in space. Aviat Space Environ Med. 2013 May;84(5):516-21


