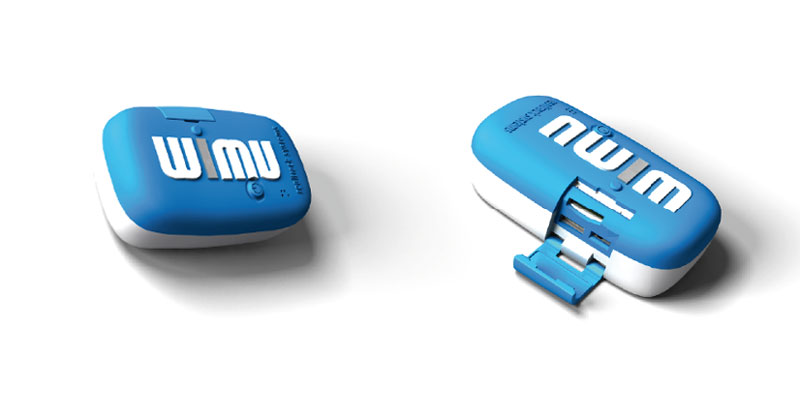
Nowadays the development of sports science technology is much more rapid than the available knowledge and scientific publications around them. One reason may be the difficulty of using all the available technologies. There is so much information that even daily work generates a complex context.
One of the most developed and interesting areas of research is the use of accelerometers and — even more interesting — multisensor devices. Accelerometers have traditionally been used to track physical activity during different kinds of exercise, including quantifying non-active physical lifestyles for healthy subjects (Dyrstad, Hansen, Holme, & Anderssen, 2014) or professional sports (McLellan & Lovell, 2012). Typical multisensor devices used to track physical activities include GPS and accelerometers combined with heart rate monitors. However, most of these devices rate the sample at a maximum frequency of 100 Hz (Cummins, Orr, O’Connor, & West, 2013; Weaving, Marshall, Earle, Nevill, & Abt, 2014).
Accelerometers now incorporate frequencies up to 1000 Hz. They track very fast movements that occur in milliseconds, like contact time during a quick running step. These new frequencies open opportunities to understand different kinds of movement patterns and segmental movement accelerations, since accelerometers can provide acceleration in gravitational forces on three axes (forward-backwards, up-down, and tilt left-right).
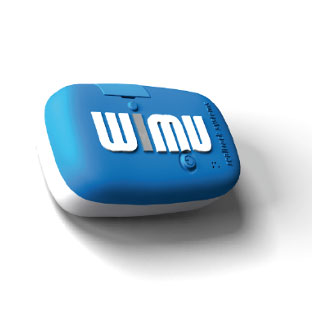
One interesting multisensor device with these new characteristics is the WIMU (RealTrack Systems, Spain). This device was designed as a tool integrating many different kinds of information since it includes a 5 Hz GPS, 1000 Hz triaxial accelerometer, and 10,000 Hz triaxial gyroscope. Another practical aspect is that this device can connect to other gadgets via Bluetooth, Wifi, or ANT+. Thus, it is possible to combine the WIMU with heart rate monitors (Garmin HRM run band) or the super-interesting MOXY, which allows oxygen saturation testing via infrared sensors. Combining all these sensors during the same activity provides a wide range of information that may help in understanding the reality from different points of view.
In Keep-fit.es, a Spanish training and sports sciences network, we use the WIMU as our reference for tracking physical activity and training loads and testing the fitness/stress status of our clients. We use it daily to gauge their progress. A good point of the WIMU is that you can fit it on many different places to test different aspects of movement and training.
The Software: Powerful and Advanced
One of my first considerations before buying any technology is the ability to analyze the raw data. Most devices and software include the option to export raw data to Excel or CSV, but then you need third-party software. However, WIMU software (QÜIKO) allows the user to analyze the raw data on the device itself, using powerful applications called monitors that facilitate the analysis and even combine different sensors. As with any advanced software, you’re likely to struggle in the beginning. You also may need advanced knowledge of raw data analysis to understand a number of curves the software can generate. After a few weeks working with the software, though, you are likely to become more experienced and more comfortable with it.
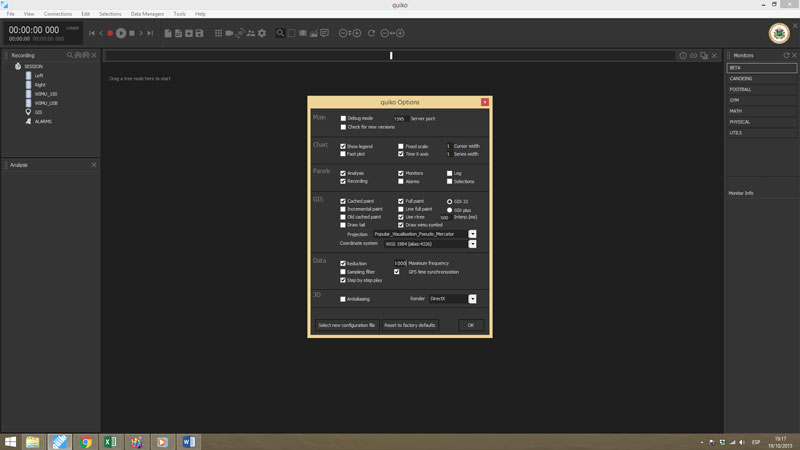
Figure 1. QÜIKO options. Between its multiple technical options, the software allows users to choose a data reduction when using high frequencies. WIMU will record from 10 to 1000 Hz, and the software can reduce the data so the file size will be smaller.
One option I especially like is the ability to combine any video format on the analysis, which helps you understand what each peak of the curve from each sensor means. The QÜIKO also incorporates a few nice visual graphics combining sensors like the gyroscope and the accelerometers, allowing the option to track this information in real time via a WiFi connection. This will help you, for example, with the encoder mode.
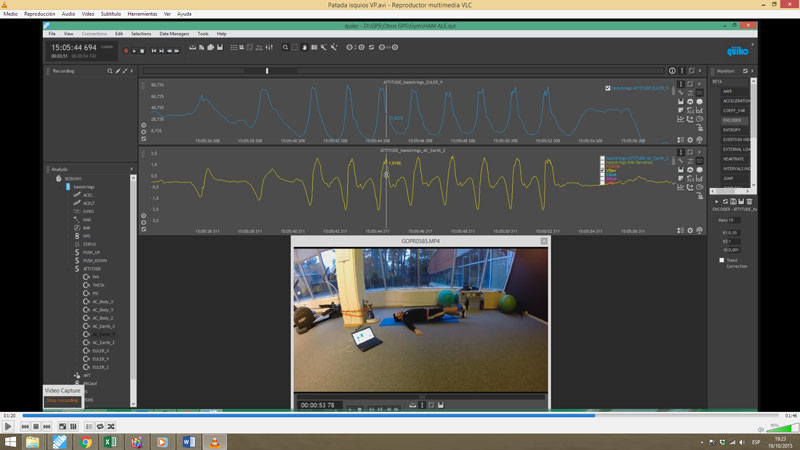
Figure 2. QÜIKO dashboard. The movement is a hamstring kick with a VersaPulley. The Y-axis gyroscope, in degrees, is in blue. In yellow, vertical speed as calculated by the encoder monitor. With the video, we can appreciate how the highest speed is achieved when the leg is closest to the ground.
Team Sports Uses
As fitness coach of the Latvian Football Association team, I use the WIMU every day for a variety of different purposes: to test each player’s individual fitness, check recovery status, and ensure that daily training suits the load we expect. The Garmin HRM band provided with the WIMU opens the option to use the heart rate variability analysis. Immediately after waking up every morning, players sit in a quiet, slightly dark room at a comfortable temperature for 10 minutes with their heart rate bands. This information is downloaded from the WIMU to the QÜIKO and analyzed (Figure 3). QÜIKO heart rate variability analysis includes time domain and non-linear variables, as they have been shown to be the most validated during short-time analysis (Buchheit, 2014).
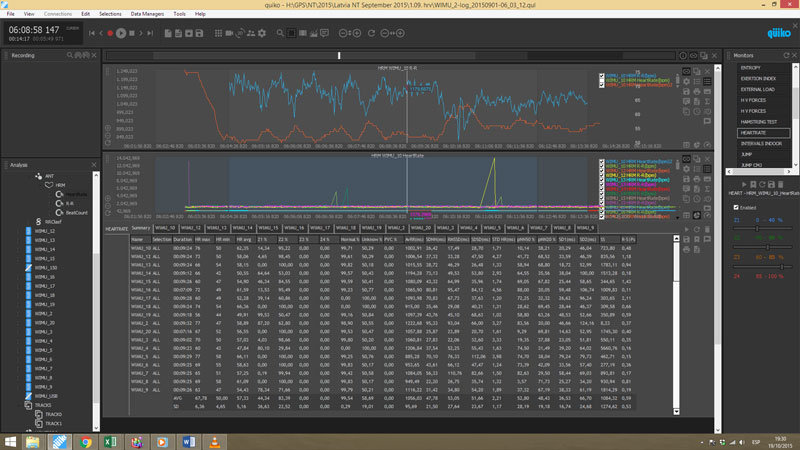
Figure 3. HRV analysis for multiple WIMU devices. The heart rate monitor allows simultaneous analysis of any number of devices, and it includes time dominion and non-linear analysis variables. It also includes a medium-power filter for autopic beats, with a high concurrence with the Kubios software (unpublished data).
During training, I use a GPS + accelerometer + heart rate device to track each player’s load. The football monitor combines the latest advances and most commonly scientific proved variables, giving a huge amount of information. In most cases, you will need to select what is most relevant for you and your sport within the summary option (Table 1). Usually, most of the monitors have the option to export this analysis to Excel, including averages and standard deviations.
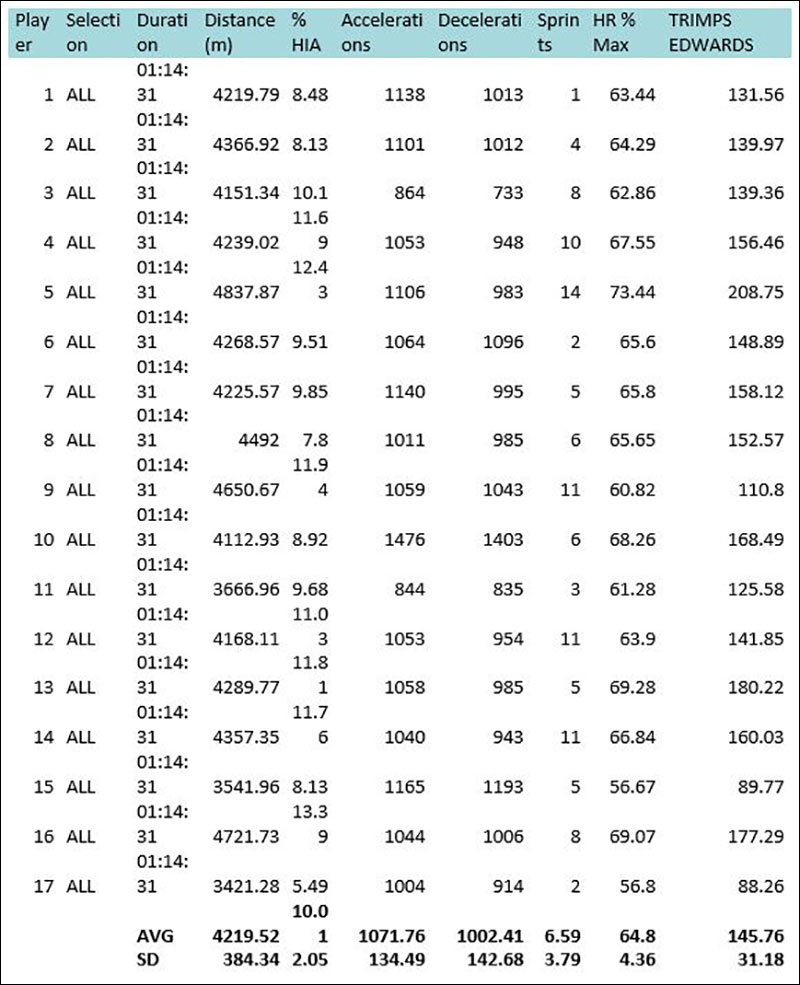
Table 1. An example of a soccer training summary with GPS and accelerometer variables.
The Encoder Option
An accelerometer of 1000 Hz opens the door to many different kinds of analysis, including using the WIMU as a linear or rotational encoder. An encoder is a tool used to control the speed of a particular movement. When the movement is linear, you may use a linear encoder. With rotating movements, you may use a rotational one. Usually, linear encoders include a cable that is extended during the movement, assessing the speed of this extension. Rotational encoders use a wheel rotating around a light cell to assess the speed.
WIMU can be used with both types, but the information you get might be different. Using the accelerometer as a linear encoder lets you easily convert this acceleration to speed—in fact, the encoder monitor does this its own. This monitor also provides important information such as displacement, concentric and eccentric maximum, average speed, and mean propulsive speed (Gonzalez-Badillo, Marques, & Sanchez-Medina, 2011) or RFD (Oliveira, Corvino, Caputo, Aagaard, & Denadai, 2015) (Figure 4).
As a rotational encoder, you can use the appropriate channel from the gyroscope to provide the information in angular velocity (degrees per second). The encoder monitor also gives the chance to export the analysis to Excel, and for advanced analysis it could be interesting to export the raw data to various formats such as CSV, Excel, text, and so forth.
The software also includes the option to set a target speed range. This feature is useful if you are interested in stopping your clients’ repetitions after a percentage of speed decrease. Using speed to control resistance training has been shown to be more effective and secure than other methods such as % RM (Gonzalez-Badillo et al., 2011).
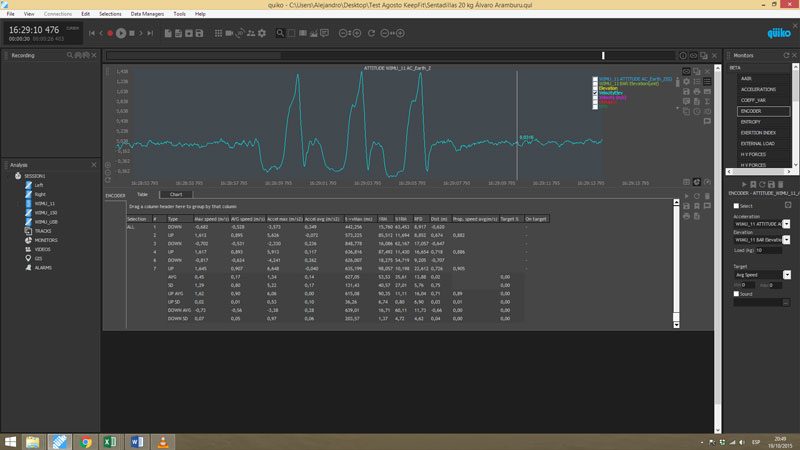
Figure 4. Encoder monitor during a deep squat test. The graph represents the estimated vertical speed (m/s) derived from the accelerometer at 1000 Hz.
It is also interesting to use the accelerometer by placing the WIMU on different parts of the body, not just on a bar. For example, we place it on the forearm close to the wrist during some of our training with tennis players, or inside the harness between scapulas during chin-up endurance testing (Figure 5). With this kind of analysis, we can track the power of a drive and how it varies during a game or training session.
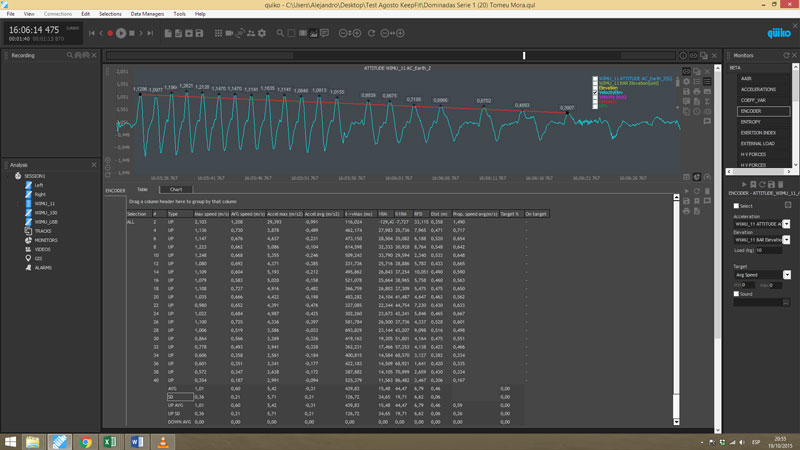
Figure 5. WIMU used to test chin-up endurance. On the graph, you can easily appreciate how the athlete is able to make constant curves and peaks on the first repetitions and while the test is progressing this curves are longer, more irregular and with fewer speed peaks (which means more fatigue)
Using the Gyroscope for Movement Analysis
I have dramatically changed my clients’ analysis since discovering the gyroscope. In the past, I based resistance training on muscle training. Nowadays, I prefer to train movements. Previously we didn’t have the technology to test movements with objective data during dynamic actions. Thus, we used angle analysis with manual or video tools, but the analysis was either on static positions or in not real time. With the WIMU, it is now possible to test any angle on any dynamic or static movement/action. These ranges from a simple hamstring range of motion test in a supine position to an advanced hip movement pattern while walking.
Since I started working as a football fitness coach, I realized that the hips are at the center of most injury problems. These problems are not limited to football players. They remain possibilities for anyone, especially the sedentary or elderly. As a result, we created a battery of tests using the WIMU to control the range of motion of important joints. These tests include hip flexion in a supine position with both extended and flexed knee from 90o, internal and external hip rotation in a prone position, ankle dorsiflexion with the knee touching the wall, maximum hip extension in a prone position, and leg abduction in a supine position. It is interesting to see how many imbalances are revealed in just 10 minutes with these simple tests (Table 2 and Figure 6).
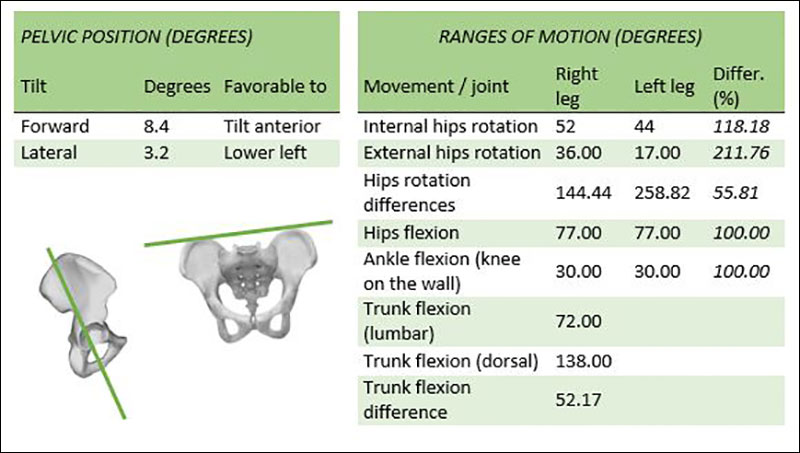
Table 2. Results from a range of motion and pelvic position test using the WIMU
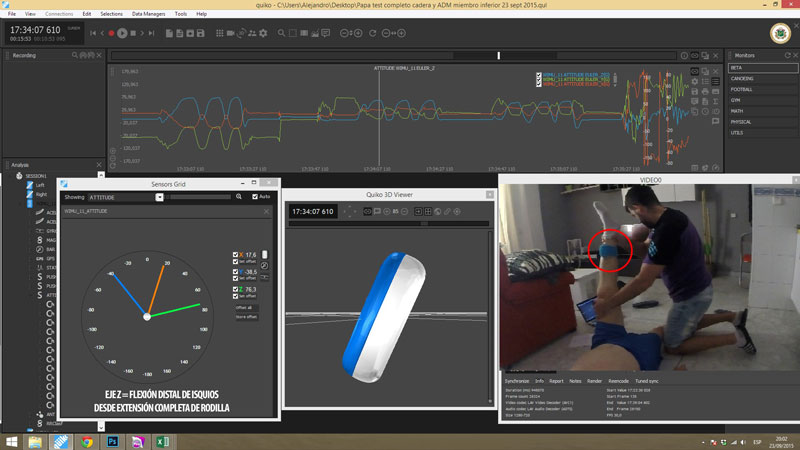
Figure 6. Hip flexion test. The WIMU is placed on the frontal tibia lower position. The left circle shows the degrees on the three spatial axes. The Z axis, in this case, shows 76 degrees of flexion.
We have also developed an easy tool to adapt the WIMU to hip position use. I have been obsessed with hip-position testing since many problems related to the lower limbs, walking, falling, or low-back pain come from this area. Placing the WIMU on the designed pocket, we can analyze each axis of the gyroscope to get information from the tilt anterior or posterior position (Z axis), hip dissymmetry (Y axis) and transverse rotations (X axis) (Figure 7).
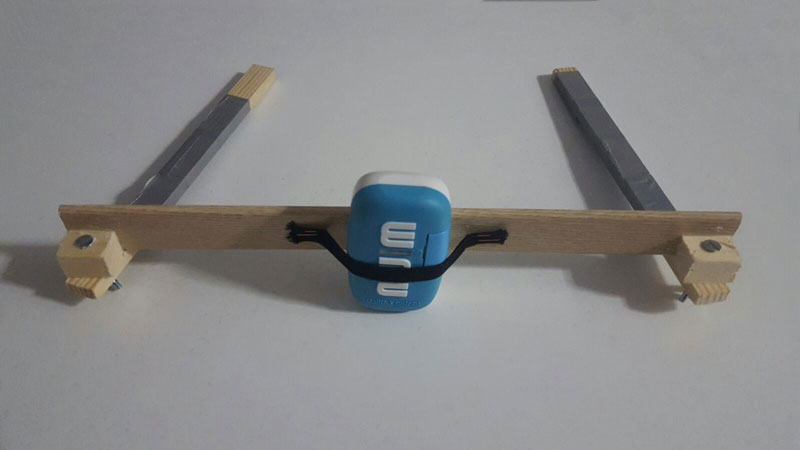
Figure 7. Inclinometer constructed to test hip position with the WIMU. Lateral pins are placed on both iliac crests and the WIMU is situated at the back.
Combining Different Sensors for Gait Analysis
When clients come to us at Keep-Fit.es to improve their running or to lose weight, we ask: are their walking/running movements patterns correct? (see example in Figure 8). Our basic objective is giving our clients adherence to sport and training, in general, and injuries may impede this ability. We combine the power of the accelerometer and the gyroscope. With the raw data, it is possible to analyze anything from any sensor on any movement, especially when it is linked to the video. However, some interesting monitors on the QÜIKO—such as the steps monitor—automatically give information related to each stride. More important, it creates a split from each one for further raw data analysis.
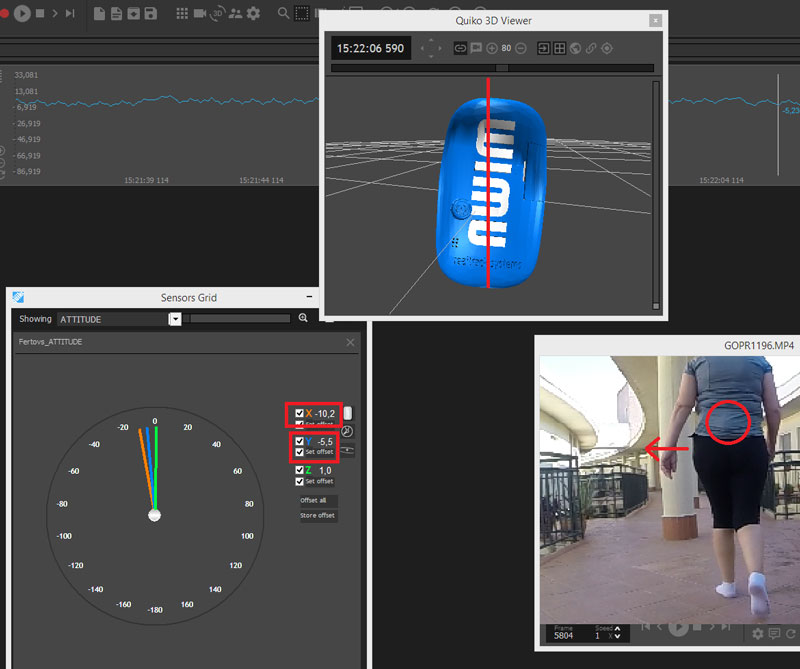
Figure 8. In this case, the woman was diagnosed with left piriformis syndrome. While she was walking, we could see on the 3D viewer how the WIMU is moved on the upper part to the right when she steps with her left foot. This occurs because the left hip moves excessively to the left, exactly 5.5 degrees, with 10.2 degrees of rotation to the right.
To do running/walking analysis, we place the WIMU on the sacroiliac joint in a vertical position, fixed with a belt around the hips. We take an interval of about 30 seconds and analyze it. Table 3 shows some practical information captured with this test. We can see how the athlete has almost the same maximum and average impact stepping with both legs. However, in analyzing the gyroscope, we found that when stepping with the left foot, the hip moves laterally to the left since the WIMU is moving 4.2 degrees to the right. This imbalance may result in an injury, especially if these degrees increase. A possible reason may be a weaker gluteus medial on the left side.
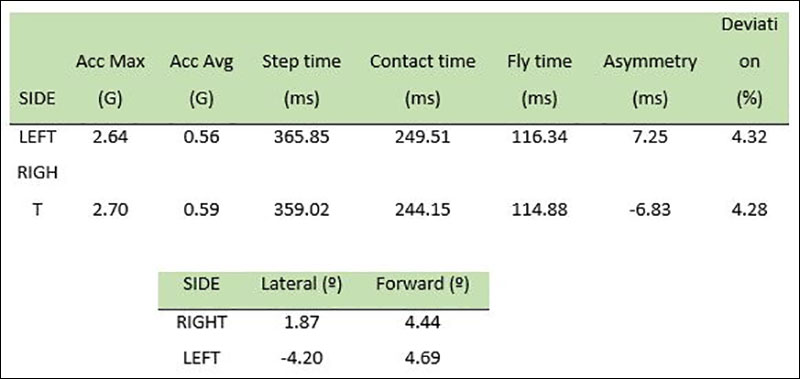
Table 3. Running analysis.
Conclusions
Actual technologies lead the sports performance analysis market, and this will be even more apparent in the future. Despite all these exciting and awesome opportunities, sports scientists and coaches will select the most useful tools for their purposes, and of course, the ones that best suit individual budgets. To have so many good sensors on the same tool, such as the WIMU, will help you save money despite the necessary learning curve.
However, this device is not a substitute for other tools: speed cells are still probably the best option for racing times, smaller accelerometers could be placed on other interesting parts and would have longer battery life, and more user-friendly software could help with profiles that just need some quick analysis. WIMU is yet another option and definitely will help you improve both your clients’ performance and—what is for me even more important—your own practical knowledge.
Please share so others may benefit.
[mashshare]References
- Buchheit, M. (2014). Monitoring training status with HR measures: do all roads lead to Rome? Front Physiol, 5, 73. doi: 10.3389/fphys.2014.00073
- Cummins, C., Orr, R., O’Connor, H., & West, C. (2013). Global positioning systems (GPS) and microtechnology sensors in team sports: a systematic review. Sports Med, 43(10), 1025-1042. doi: 10.1007/s40279-013-0069-2
- Dyrstad, S. M., Hansen, B. H., Holme, I. M., & Anderssen, S. A. (2014). Comparison of self-reported versus accelerometer-measured physical activity. Med Sci Sports Exerc, 46(1), 99-106. doi: 10.1249/MSS.0b013e3182a0595f
- Gonzalez-Badillo, J. J., Marques, M. C., & Sanchez-Medina, L. (2011). The importance of movement velocity as a measure to control resistance training intensity. J Hum Kinet, 29a, 15-19. doi: 10.2478/v10078-011-0053-6
- McLellan, C. P., & Lovell, D. I. (2012). Neuromuscular responses to impact and collision during elite rugby league match play. J Strength Cond Res, 26(5), 1431-1440. doi: 10.1519/JSC.0b013e318231a627
- Oliveira, A. S., Corvino, R. B., Caputo, F., Aagaard, P., & Denadai, B. S. (2015). Effects of fast-velocity eccentric resistance training on early and late rate of force development. Eur J Sport Sci, 1-7. doi: 10.1080/17461391.2015.1010593
- Weaving, D., Marshall, P., Earle, K., Nevill, A., & Abt, G. (2014). Combining internal- and external-training-load measures in professional rugby league. Int J Sports Physiol Perform, 9(6), 905-912. doi: 10.1123/ijspp.2013-0444



I consider this equipment a great tool for training
I am developing a study in the area of gymnastics, in which I have to measure the speed of rotation of the pirouettes and the height at which the gymnast rises from the apparatus.
This study, later evaluated by the Scientific Commission of the Portuguese Gymnastics Federation, I intend to send it to the European Gymnastics Union and to the International Gymnastics Federation.
I only need 1 equipment, I would like to know if you can help me:
with the equipment, or what is the individual value of