

By Ken Jakalski
Taking the guesswork out of speed goals and reps for short and long sprint workouts.
If you coach sprints, you most certainly run sprints in training.
The following are the questions I have relative to speed workouts, and the answers I have received from coaches in previous years:
At what SPEEDS do you have your sprinters run workouts? Most coaches simply assign percentages to each athlete—like “95%” or “really fast.”
How are you determining those speeds for each athlete? Most coaches work back from the athlete’s top racing speed over a recorded distance. They translate that to a fly-in time for sprint segments. In other words, they are “guessing.”
What are the distances you have your athletes run? Coaches select the distances based on the event itself– shorter reps for the 100 and 200 and longer reps for the 400. Coaches believe the distance targets a specific system.
Component of Fitness
|
Intensity
|
Duration
|
Rest Ratio
|
Distance
|
Speed
|
> 95%
|
< 5 sec
|
1:30 to 1:50
|
20 – 40 m
|
Speed-Endurance
|
≥ 95%
|
6 – 20 sec
|
1:10 to 1:20
|
50 – 180 m
|
Special Endurance I
|
≥ 95%
|
20 – 40 sec
|
1:10 to 1:20
|
200 – 300 m
|
Special Endurance II
|
≥ 95%
|
40 – 90 sec
|
1:10 to 1:20
|
350 – 600 m
|
Intensive Repetition
|
80 – 90%
|
10 – 70 sec
|
1:4 to 1:8
|
75 – 500 m
|
Extensive Repetition
|
≤ 75%
|
10 – 120 sec
|
1:1 to 1:4
|
50 – 600 m
|
How many reps of these chosen distances do you run in a single workout? Coaches simply make up the number of reps based on their perception of fatigue in their athletes. The problem with this is that the number of reps does not reveal what is happening to changes in force applied to the ground. Runners will often “negotiate” the speed simply to complete the number of reps the coach has assigned. In other words, it is simply a case of one fool getting other fools tired, with runners believing the goal of the workout is to complete the assigned number of repeats.
We have all arbitrarily assigned the total number of reps in our particular workouts, and we base those numbers on what experience has shown to be what athletes should be able to complete. In the past, we were not able to determine what was happening with repeated reps relative to muscular force output. What we observed was athletes running slower with each rep. However, were those drops in times the result of a reduction in available energy, a sign of muscular force impairment or just athletes “pacing” to complete the number of assigned reps?
Most coaches still believe that if we 1) increase the energy supply, performance improves, and 2) if we decrease energy demand, performance improves. As a result, they believe sprint training should target both supply and demand. But is the supply limit conclusion correct for SPRINTING? Many coaches accept this without question. However, even as far back as 1925, there were some doubts. The great A.V. Hill noted this almost ninety years ago:
“It is obvious that we cannot pursue our (energy supply) argument to times below about 50 seconds. These performances are limited by factors mechanical and nervous.”
Bottom line:
What is valid for distance training is not valid for sprint training.
Simple point to keep in mind:
Musculoskeletal force is progressively impaired during sprinting. What we now know is that, if we change the energy input, there is no effect. However, if we change the mechanics, we change the performance. The evidence for the significance of mechanics can be found in the ways we’ve been able to prolong force application without incurring a serious drop in force. The Klapskate is one example. The Carbon fiber blade (Cheetah) for Paralympians is another.
Video 1: Oscar Pistorius at Rice University June 29, 2010
Think force, not fuel.
All this leads to what I refer to as the SPEED RESERVE approach to training…or ASR.
THREE KEY QUESTIONS:
- What is ASR?
- Why was this important to me?
- How does it apply to the speed training I am currently doing?
ASR or Anaerobic Speed Reserve is based on an algebraic procedure used to project speed-duration curves from 3 to up to 240 seconds and beyond.The algorithm can predict a final time/distance or distance/time run for almost any runner, with greater than 97% accuracy. And the ASR prediction range extends from a few meters up to five minutes of running. The algorithm’s basis is the rate of muscle fatigue (anaerobic fibers) for each runner.
It clearly establishes that speeds decrease as the duration of sprinting increases because of force impairment and NOT because of an energy limitation. Prior to the Weyand/Bundle research papers, it was common belief (and still is among many coaches) that anaerobic fibers run out of fuel…similar to what occurs with aerobic fibers.
However, there is evidence that, up to sixty seconds, reducing the fuel supply does not change the performance.

Figure 1: Graph from JAP paper,”High Speed Running Performance is Largely Unaffected by Hypoxic Reductions in Aerobic Power”
And there is direct evidence that sprinting progressively impairs musculoskeletal force.

Figure 2: Peters Weyand’s ASR Presentation at Midwest Speed Summit 2014.
What we now understand is that the force approach can predict individual performance-duration relationships, and all athletes conform to the same curve.
Based on this focus on musculoskeletal force progressively impaired as the even duration increases, how do I train my sprinters at least relative to fast running on the track? I studied the first Weyand/Bundle paperback in 2003, looked at the algorithm and believed right away it could have a direct application to training.

Figure 3: Author’s version of the original ASR algorithm.
Since ‘03, I’ve used the formula to establish individualized speed goals for each athlete based on the speed regression algorithm found in their papers.
So, in simple terms, ASR is a way to provide individualized bouts of high speed running for each athlete on your team.
As a result, here are my answers to those first four questions:
What speeds do my sprinters train at and how do I determine those speeds? Those speeds are based on individual anaerobic reserve projection—no more guessing.
What distances do my sprinters run and how many reps of those distances do we do in a training session? I choose distances based upon my goal of extending higher meters per second over progressively longer periods of time. Some refer to this as a “short to long” approach.
There is NO SET NUMBER OF REPS in any ASR session. The workout ends for each athlete when he or she can no longer sustain the specific meters per second speed.
And there is no longer any guesswork as to what that speed should be.
Coaches can run ASR sessions once or twice a week depending on their own “cycling models,” which must take into account meet schedules, vacation days, weather conditions, and time of the season.
Think of sprinting in terms of attainable intensity and endurance in terms of sustainable intensity. As Dr. Weyand noted, “Sprinting is demand driven and not supply limited.” But this approach does not have to be limited to “short rep stuff.”
| Name | Test Data | 350m | 450m | |||
| 10m | 300m | Predicted | 4% | Predicted | 4% | |
| Athlete 1 | 0.91 | 33.21 | 40.28 | 41.89 | 55.70 | 57.93 | Athlete 2 | 1.12 | 36.57 | 43.19 | 44.92 | 56.79 | 59.06 | Athlete 3 | 1.16 | 37.88 | 44.73 | 46.52 | 58.79 | 1:01.14 |
Research shows that anaerobic systems influence middle distance performance in runners of similar abilities, and anaerobic tests can predict endurance performance.
I also use ASR for repetition work with distance runners. Each athlete runs a prescribed number of meters in a set time. By staggering them around the track with a scoreboard clock counting down from that set time, runners will approach the finish line together.
As Dr. Owen Anderson notes in his latest book, Running Science:
“The primary factors that control anaerobic performance are the same primary factors that control aerobic performance. Those primary factors are found in muscle contractility.”
The “take home” message from Dr.Weyand’s seminars on sprint performance limitations clearly suggests that sprint training 1) should target musculoskeletal force output and 2) that targeting energy pathways for sprint training is not recommended
Is this something you can use to create effective, individualized workouts for your sprinters and middle distance runners? Yes. Is it easy to do? Yes.
Although years back we contracted with Rice for exclusive rights to the algorithm (it is patented), the formula itself is in the actual speed regression papers.
Coaches with a little work can figure it out on the own. Just two measured points can provide the entire curve.
Getting the test data from a T1 short sprint (10 meters) and a T2 long sprint (300 meters) is relatively easy, and the next step simply requires coaches to plug in the data.
The good news is that you don’t have to purchase any tables or make those up on your own based on the algorithm. The Speed Calculator appears right here at Freelap.
A Historical Perspective
Why this change away from what many see as the conventional form of long sprint training?
The original Bundle/Weyand research compelled me to reconsider the way I had previously been training both short and long sprinters. As a result, what were “tossed in the dustbin,” as Frans Bosch might say, were things that did not have much scientific support.
I had to re-think my approach to workout running speeds, workout distances, and reps per workout, all of which in the past had been just guesswork on my part.
The concept of employing a “speed template” for designing workouts took root early in my coaching career.
Back in the 70’s that required looking for some chart or table as a guideline for short duration sprint training reps. A small “sprint book” from Runner’s World was my only source at the time.

Figure 4: Cover of the Original Runner’s World Guide to Sprinting
What I found in that book was the closest thing to a speed template: the speed projections Valentin Petrovski used with Valeri Borzov. Petrovki was doing what I had hoped to be able to accomplish: finding out “how much the components of sprinting can be raised, and what signs to be weighed to measure that change.”
Speed (m/s)
|
30m Fly
|
30m Blocks
|
60m Blocks
|
100m Blocks
|
200m Blocks
|
12.0
|
2.5
|
3.4-3.6
|
6.3-6.5
|
9.8-10.0
|
20.1-20.3
|
11.5
|
2.6
|
3.5-3.7
|
6.4-6.6
|
10.0-10.2
|
20.5-20.7
|
11.1
|
2.7
|
3.6-3.8
|
6.5-6.7
|
10.2-10.4
|
20.9-21.1
|
10.7
|
2.8
|
3.7-3.9
|
6.7-6.9
|
10.5-10.7
|
21.5-21.7
|
10.3
|
2.9
|
3.8-4.0
|
6.8-7.0
|
10.7-10.9
|
21.9-22.1
|
10.0
|
3.0
|
3.9-4.1
|
6.9-7.1
|
10.9-11.1
|
22.3-22.5
|
As Borzov noted about his speed training:
“Petrovski had for this task established a table of evaluation indicators, based on the performances recorded by Soviet, as well as foreign sprinters. The table, slightly changed according to practical experience, still serves a useful purpose today.”
Based on the sketchy material I had from Petrovski’s indicators, I created my own table.
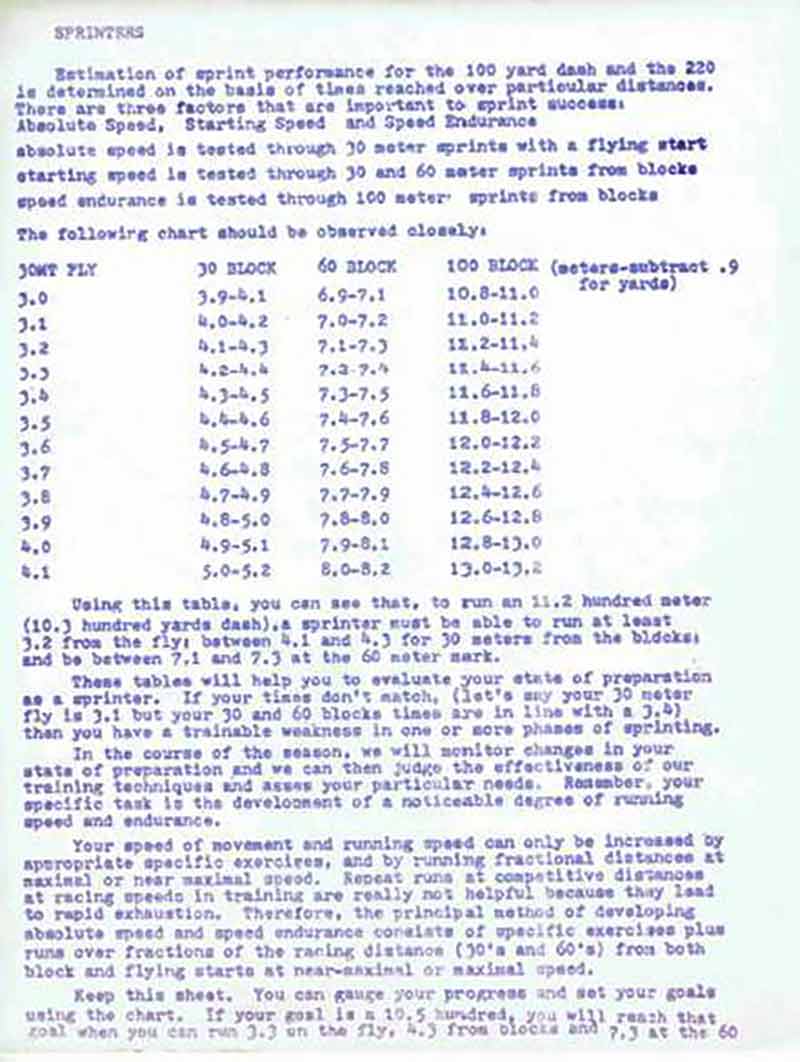
Table 4: Author’s original table.
Using each sprinter’s current best race time, I would have them run either 30 or 60 meter block or fly sprints, trying to achieve times in line with the next faster race goal.
The problem:
Those projections were not based on any studies of speed regression over time.
It was not what Dr. Weyand would describe as an example of “scientific knowledge evolving via data.”
I was just guessing– based solely on Petrovski’s attempts to determine optimal running factors for the 100 meter dash
The potential for ending the guesswork began when I realized that the algorithm contained in the Bundle/Hoyt/Weyand Energetics of High-Speed Running paper could provide me with exactly what I wanted.
I then visited the authors at the Rice University lab in the summer of ’04 to discuss how I had begun applying their work.

Figure 5: Dr. Peter Weyand at the Rice University Lab 2004.
Since ‘03, I have used the formula to establish individualized speed goals based on each sprinter’s speed regression as determined from the algorithm.
In simple terms, ASR–in addition to its performance predictive potential–is a way I provide individualized bouts of high speed running for each athlete on my team. No more guessing or making stuff up!
Please share this article so others may benefit.
[mashshare]References
Anderson, Owen. Running Science. Champaign: Human Kinetics, 2013. Print.
Bundle, M., Hoyt, R.W. and P. Weyand. Energetics of high-speed running: a new approach to assessment and prediction. Journal of Applied Physiology, 95: 1955-1962, 2003.
Guide to Sprinting. Mountain View, CA: World Publications, 1973. Print.
Weyand, P. and M. Bundle. Energetics of high-speed running: integrating classical theory and contemporary observations. American Journal of Physiology: Regulatory, Integrative and Comparative Physiology, 288: R956-R965, 2005.
Weyand, P., Lee, C, Martinez-Ruiz, R., Bundle, M., Wright, S., and M. Bellizzi. High-speed running performance is largely unaffected by hypoxic reductions in aerobic power. Journal of Applied Physiology, 86: 2059-2064, 1999.

That table is the exact table from Frank Dick’s maximum sprinting speed article.
Hi Steve!
You are indeed correct that the original table was Frank Dick’s work, with columns added for coaches wanting a quick standard for any over speed or sprint resisted work. That was the wrong chart. The right one now appears as Table 4.
The intended table was my extension of Petrovski’s targets, which focused on the segment performances that Borzov needed to achieve in order to run a specific time. I simply extrapolated additional ranges more in line with times my high school athletes could achieve. You can tell the age (and my age) because I began talking in yards!
I appreciate your pointing this out, and apologize for the delay in finding that old blue-line copy. I don’t know how many still remember making copies by typing on stencils and then attaching those to the barrel of a mimeograph machine.