This is part one of a three-part article on how to improve your 40 yard dash time.
Assess Your Speed
After establishing what is possible in the 40 yard dash with Usain Bolt, many coaches and athletes will likely ask how fast they are from a team or individual perspective. Now that the ground work is done with electronic timing, the next step is testing the 40 yard dash and seeing how to access not only the results (final time), but how one got there (splits). Without electronic timing, the true confidence of the accuracy or validity of short sprints can never be certain. In this article we will address how to time the 40 yard dash or other short sprint such as 30 or 40 meters with a simple checklist. This article will also share how to assess the 40 in a way that analysis a no-brainer.

Repeatability and Context
Arguably the most important timing factor is that the test be repeatable, meaning every single time you test the information is consistently representing the same circumstances as the earlier test. Small subtle changes such as different running surface, testing a team at the end of a week versus earlier when they are fresh are examples that may skew the data afterwards. Just testing an athlete in front of a small crowd and music blaring may be enough stimulation to elicit a better performance if the athlete was tested early in the morning alone with one coach timing. A good rule of thumb is to record the conditions or contextual information of the testing and repeat the same set-up after. Sometimes the exact numbers are not as important as the improvement or change. Comparison can only be done when the procedure on multiple tests are virtually the same. The great benefit of electronic timing is the consistency being nearly perfect and times will be valid provided the users followed the directions and measured the distances properly. Good record keeping and writing down any notable differences on test day will help make analysis more insightful and can provide explanations when unexpected performances arise.
Understanding Splits and the Acceleration Curve
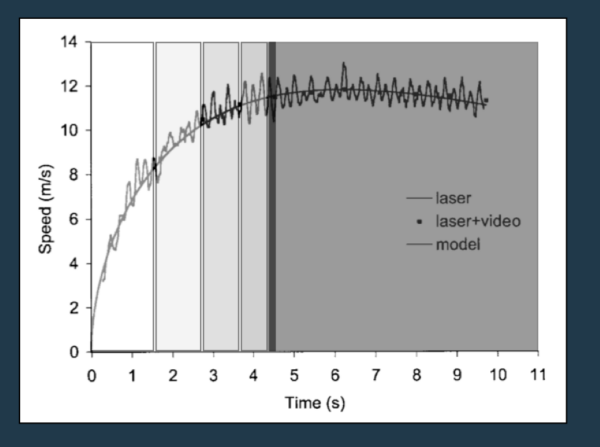
In the first article, we shared Usain Bolt’s race plotted out step by step for the entire 100m and focused on the beginning part, to get a very precise reading on what he could run the 40 yard dash in. The 2009 analysis from the World Championships in Berlin was not the first time sport scientists used laser and video to get splits, or times between every 10 meters. Laurent Arsac and Elio Locatelli created a working model to estimate energetics of the 100m by using data from world champions in 2001. This study is important, as it shows the demands of the sprinting on the athlete from a fatigue perspective and shows how fast the athlete is going over time. The chart is a wonderful explanation of what is going on in both velocity and time, and shows the fatigue pattern that is hit near the 7 second mark of the race. Since most forty yard dashes are under 5 seconds, the effect of fatigue, even if the athlete isn’t in “game” shape, is really not a factor here. The curve of the acceleration is steep at first, and then levels off as the time, and respective distance, increases. Breaking the curve down can be done at every step, but for convenience and practical matters, uniform segments of 10m or 10 yards is the standard way to evaluate what is happening. By dissecting the run by 10m or 10 yard increments, the times of each point can be subtracted by one another to get splits for simple evaluation. This is important for all sports since the ability to accelerate is a fundamental need for all sports that require repeated sprinting from stationary or slow starting points. Analyzing the ability to overcome inertia in a simple linear speed test should be the cornerstone to athletic testing.

Figure 1: The Arsac and Locatelli 100m chart with gray zones indicating amount of estimated time spent in each 10m split.
The above chart is adapted from the Arsac and Locatelli study, and annotated for the labeling of the ten meter splits based on time. Each shaded region represents the time spent in each 10 meter segment, showing how athletes, not just sprinters accelerate generally. The final black line is the 40m mark, and the darkest shaded region is the rest of the 100m dash. This chart is not representing Usain Bolt, but the curve is very similar and can be used for most sprinting models outside track and field.
Example Splits and Reasons Behind the Numbers
Below are two similar 40 yard dash times but with much different reasons and contextual specifics such as one running on the grass and both being positions in football. The important lesson here if we didn’t’ know the details of the athletes and how they ran the 40 yard dash, confusion and some misleading assumptions could be made regarding their athletic ability. Note the splits, while very informative, don’t share the whole story so it’s useful to use a smartphone with the video app such as Dartfish Express. The purpose of the article it to look at the timing and general patterns of running and not focus on the mechanics of running and how it interacts with time. The next article will review more specifics of pairing both video and electronic timing, but for sake of focusing on timing splits, we will go over more general concepts first. At the end of the day, speed in the form of timing is the result we are looking for, and the rest is describing the results we achieve.

Figure 2: Athlete Comparison in the 40 yard dash.
On the right side of the chart you can see the splits being very different but the final time being nearly identical. What is impressive at first glance is that athlete A is 285 pounds and ran a 4.79 while Athlete B being lighter was only running a 4.65. One could argue that athlete A had a better performance because larger athletes have a harder time expressing speed from a poor power to weight ratio, but if one looks deeper into the details athlete B had less going in his favor. One example of the need to interpret the entire run is the grass versus track surface and the possible arousal of athlete B running his time during a Pro Day. Regardless of differences in testing and results, one must compare themselves to themselves because improvement is what everyone is looking for. Not only does one need to look at the general splits of acceleration, but the specific patterns unique to each athlete. Eventually the entire 40 yards or meter equivalent must be solid, as the total performance in all parts is a good sign of well-rounded speed qualities for many athletes.
General and Specific Patterns of Splits
Very little variation exists in running the 40, but to crudely summarize most performances, some are fast everywhere, some slow everywhere, some are average everywhere, and some are stronger in the beginning or end of the run. Most will not deviate from the normal curve of accelerating in general, and follow the same pattern with lesser abilities in all parts of the 40. Included in figure 3 are five example profiles of 40 yard dash performances with splits to compare how each type runs. Some athletes like NFL lineman may be impressive in the first 10, but their body weight makes them very poor finishers, while some lighter athletes may finish well like soccer players who are use to running further and have less emphasis on weight training, making them less explosive earlier in the run. Many reasons exist, and later in the series we will review those specifics, in the meantime, here are the five example splits to review.

Figure 3: Theoretical example of splits for 40 yard dash based on NFL combine first movement timing with electronic splits.
Notice that each split is faster than the previous segment unless one is grossly unprepared and testing is more like a lost cause at this point. Since elite sprinters are able to accelerate for 60 meters, the 40 yard distance should be all acceleration if one is prepared and trying. While blocks do add an advantage, all athletes will accelerate similar to sprinters since the “three point start” has a lot of commonalities to a full track start. The last split from 30-40 yards will not be much better than 20-30 yards, but it should be clearly and consistently faster or one is lacking top speed or maximal velocity ability. While most team sports emphasize acceleration as most plays are short in both time and distance, plays that are longer are often dangerous and game changing such as a kickoff return in American Football or full field play in international football. Top speed is also a good reference point for acceleration as one is increasing speed to reach maximal velocity and a popular choice for coaches to prepare the hamstrings and other muscle groups to help with injury prevention.
Summary
In the second part of the series we will review common and widely accepted approaches to improving general speed to improve the 40 yard dash based on splits, be it just the first 10 yards or every 10 yards. Splits are the most simple and direct way to break down what is going on in a 40 yard dash, and having that information accurately can direct coaches and athletes to the right choices in training and development.
Please share this article so others may benefit.
[mashshare]References
Modeling the energetics of 100-m running by using speed curves of world champions Laurent M. Arsac and Elio Locatelli J Appl Physiol 92:1781-1788, 2002. First published 30 November 2001; doi: 10.1152/japplphysiol.00754.2001


My son is a very fast starter. His first 10 yards is clocked at 1.52, and after that his time starts to slow down, and his 40 time will be 4.92. He is 6’1 200 lbs. He has about 10% body fat. I have tried everything to get get his top end speed better, but no luck. could you please give me some advise. He will be playing D1 football next year Strong Safety, and I’m trying to get him faster.
Thanks for your help,
James Stennis
Hi James, i think that getting help with some local trainer is best than try to get information on internet, running is a very complex moviment, and some minor adjustments can help a lot.