By Simon Wegerif, Director, HRV Fit Ltd
Here at ithlete, we enjoyed Andrew Flatt’s recent blog post regarding the interpretation of HRV trends in athletes. This article complements Andrew’s work by showing exactly how you can apply HRV to training using ithlete.
Introducing ithlete
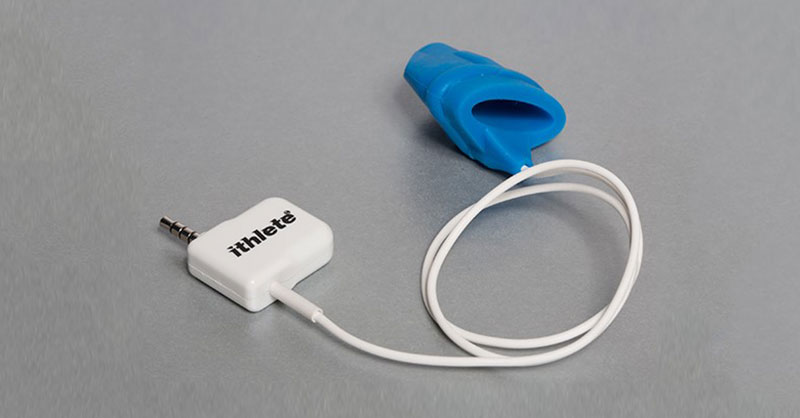
Following almost a year of research, founder Simon Wegerif introduced ithlete in 2009 . His goal was to take HRV measurement out of the lab and put it into the hands of athletes so they could benefit from an easy-to-use barometer of fatigue and recovery. Six years later, ithlete is not only the leading HRV app but also the only one scientifically validated. This revolutionary training app allows you to personalize your training program based on a simple one-minute measurement.
Andrew’s article discussed how to use the InRMSSD HRV parameter to measure HRV. He highlighted several reasons why lnRMSSD appears to be the preferred HRV parameter for monitoring. One is that it can be assessed in just 60 seconds. Another is that it is less influenced by breathing rate, making it more suitable for field usage than, for instance, HF power.
ithlete uses a patented formula to provide a more intuitive and easily interpretable figure for non-expert users. The value you get from the app is the natural log-transformed RMSSD multiplied by 20 (lnRMSSDx20). It gets no simpler than the color-coded training recommendation feature, displayed after you’ve taken your one-minute measurement. These recommendations let you adjust your daily training or perfect your taper before a major race or competition.
Here is what colors are telling you:
Green – Within the normal range from your personal baseline, an indication of an ideal time to train.
Amber – Below your normal range, so you need to train cautiously with lower intensity or volume. HRV will typically show changes before performance starts to drop and thereby serve as an early warning sign of fatigue accumulation. It’s a common misconception to expect a drop in performance here based on a lower HRV score. This is not always the case, and may, for example, merely signal anxiety on the day of a competition.
Red – While uncommon, red should be taken seriously. Either take a guilt-free rest day or do low-intensity exercises, yoga, or light swimming—all of which speed recovery.
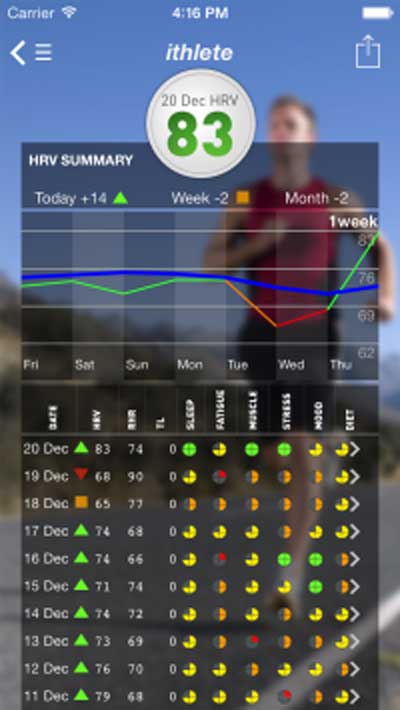
Figure 1: ithlete normal range.
Daily ithlete readings indicate how well recovered and ready for physical strain your body is. Once you give the body training loads it can cope with, your training effectiveness will improve, and you may see a decline in day-to-day HRV variation. Ultimately you will stop losing time to non-functional overreaching (NFOR), related illnesses (such as coughs and colds), or unproductive sessions.
Sometimes a high HRV score can appear red. As Andrew pointed out, high HRV is not always good. Although research in this area is not as clear as it is for low HRV, high HRV (or a rapid upward trend over several days) can signal adrenal fatigue and even exhaustion. Progression toward, and recovery from, this state will often go via low HRV. This progression may seem confusing but is consistent with theories about how the body deals with increasing levels of stress and challenge in the environment, ultimately trying to prevent further damage.
The ithlete app has multiple features. It enables you to track daily, weekly, and monthly changes in your HRV score. Of course, every individual is different, so the most important figure to look for is the change from your personal baseline. An upward trend over time indicates an increasing fitness level and is more important than the absolute scores.
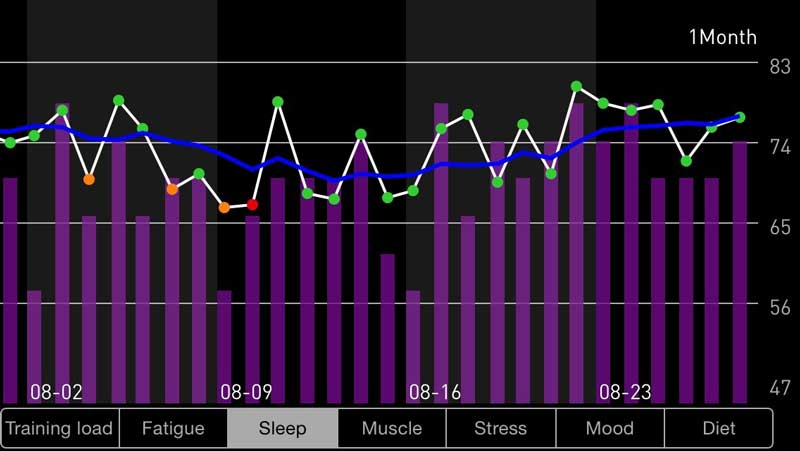
Figure 2: ithlete sleep chart.
Using the dashboard to view your HRV scores and baseline over time at a glance is another way to interpret your data. Simply turn the device to landscape to view the interactive chart allowing you to investigate the relationship between HRV, training load, and subjective feelings. The ithlete app allows you to record your subjective metrics to build a picture of health and fitness. Tracking those subjective indicators (sleep, fatigue, muscle soreness, stress level, mood, and diet) using built-in sliding scales makes it easier to recognize trends and patterns in the body’s response to behavior.
ithlete Pro
ithlete Pro is ideal for the user who values the data garnered via the ithlete mobile app and wants to extract greater insight from the daily readings. Its Training Guide provides a unique pictorial representation of the user’s energy and recovery states as well as individualized zones, allowing the user to choose the most suitable training on that particular day. It also interprets each new reading and delivers advice in a single straightforward sentence.
The Training Guide chart is marked in zones to help you decide on the best kind of training, based on your current state. Andrew Flatt described the most common response to overload training: a progressive decrease in your HRV, followed by an increase in resting heart rate. This is your typical alarm response to a stressor, activating the sympathetic arm of the autonomic nervous system. The fight-or-flight response is only meant to be activated for a short time, and chronic activation leads to stress. ithlete Pro will show it in the top left quadrant of the Training Guide.
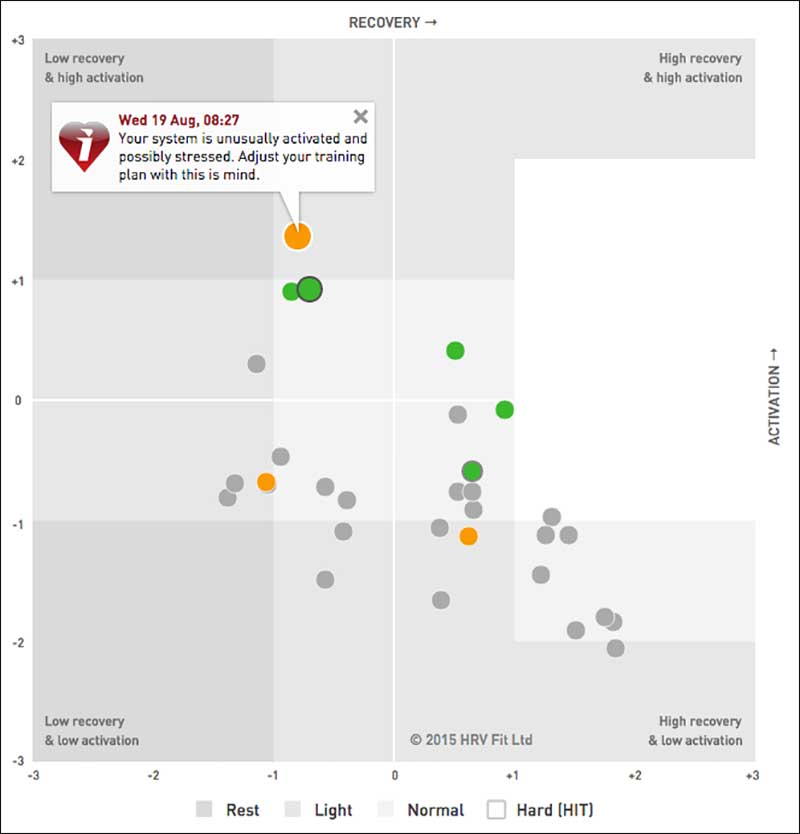
Figure 3: ithlete HRV Trend.
Andrew also observed that an increasing HRV trend throughout training is not always a good thing and thus should not always be interpreted as such. ithlete Pro will measure your HRV and indicate it in the bottom right quadrant. Activation level progressively reduces, so you might not feel sufficiently energized to perform intensive reps, and at the extreme bottom it’s likely you would feel little energy or enthusiasm. If this situation persists for several days, it can eventually become adrenal fatigue—which requires rest and special attention to your diet to recover quickly.
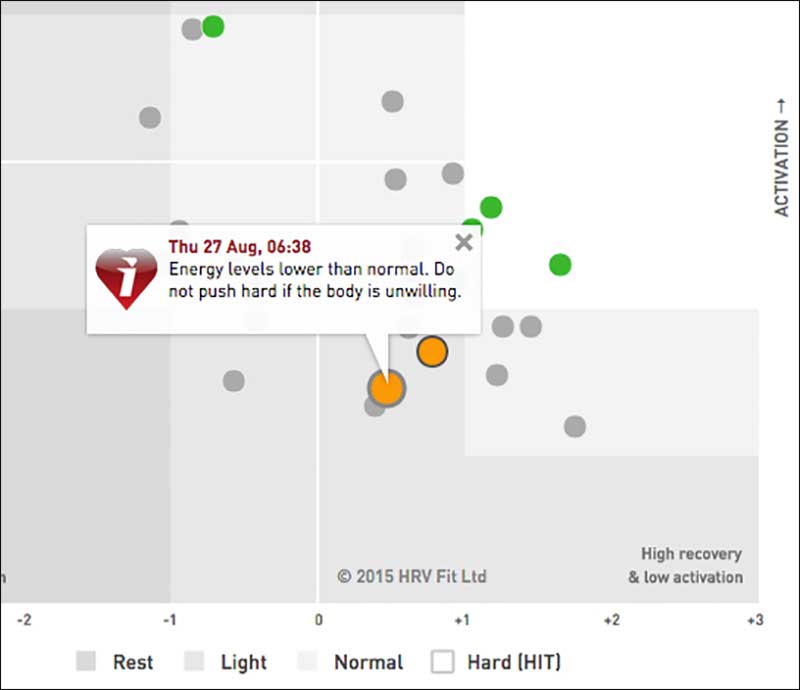
Figure 4: ithlete energy levels lower than normal.
ithlete Pro also includes a fully configurable timeline chart for HRV, resting heart rate, training load, and subjective data, enabling better insight into the lifestyle factors with the greatest impact on performance and recovery.
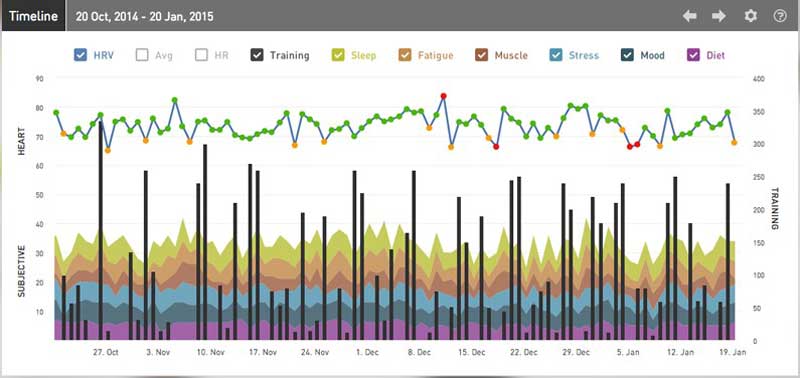
Figure 5: ithlete data visualizaton.
Selecting one or more of your subjective data points (sleep, fatigue, muscle soreness, stress, mood, and diet), makes it easy to visualize patterns and relationships. For example, you might display training load, diet, and HRV to investigate if your eating habits are responsive to training load and what impact the two have on HRV and recovery. Another example might be to show just sleep, fatigue, training loads and the HRV rolling average to see how long it takes you to recover, as well as how tired your training is making you feel. This type of information can be hugely helpful. It is much easier to control a trend or habit when you become aware of it.
For those of you who are coaches or team sports scientists, the ithlete Team App provides a single destination for viewing and managing team data. It resides in the Cloud (powered by Amazon Web Services) making it secure and accessible any time of the day.
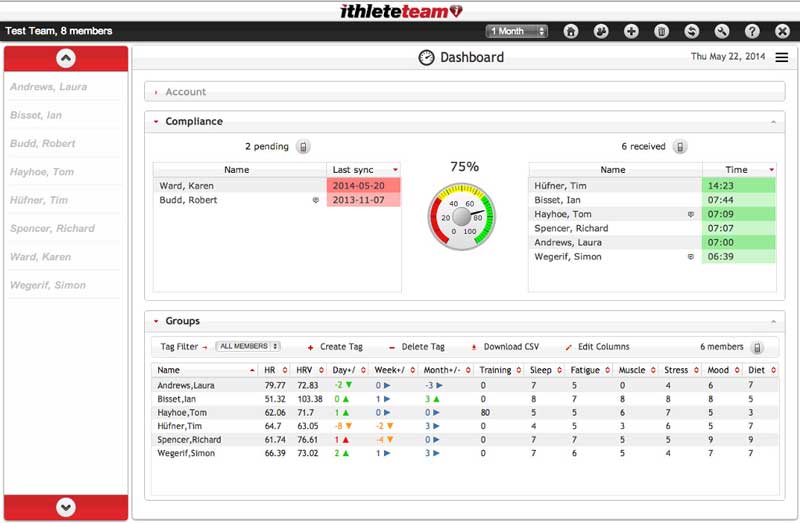
Figure 6: ithlete Team App.
The dashboard provides coaches with a snapshot of player stats. The top level gives a percentage of players who have uploaded a measurement that day. What about those who haven’t? No problem. The built-in SMS feature sends reminders and feedback. You can then look into your team’s readings. These readings include daily recommendations, heart rate (HR), HRV, HRV change, subjective scores, and training load (often expressed as RPE).
Coaches have to manage various demands, whether it is keeping a squad of players fit throughout a season or balancing demands of elite players across multiple competitions. The ithlete Team App enables you to record and monitor players’ HRV and training load throughout the season, identifying and responding quickly to trends. If a player is getting fatigued after a long run of games, ithlete will quickly identify this situation before any other symptoms are present—thereby allowing coaches to incorporate additional rest and recovery time into the program. The variable time view on the graph allows you to analyze 1, 3, 6 or 12 months of data at any time before zooming in on a user-defined period.
Conclusion
Using your HRV score alone to assess training status can prove challenging. Training with ithlete allows you to observe HRV changes in context by recording your subjective data and training loads. This data provides a comprehensive picture of your training regimen.
We know it’s difficult to adjust training or lifestyle factors based solely on one parameter. Here at ithlete, we’ve removed the need for guesswork or complex calculations from your training schedule. Using the training recommendations in our Training Guide exclusive to ithlete Pro is the best thing you can do to make your training safe and effective. Everything we put into the ithlete, Pro, and Team apps is scientifically validated. This is why we are the leading scientifically founded sports app in HRV measurement. We are ithlete.
Please share this article so others may benefit.
[mashshare]References
Validity of the ithleteTM Smart Phone Application for Determining Ultra-Short-Term Heart Rate Variability by Andrew A. Flatt1, Michael R. Esco. Journal of Human Kinetics volume 39/2013, 85-92 DOI:10.2478/hukin-2013-0071
Smartphone-enabled pulse rate variability: An alternative methodology for the collection of heart rate variability in psychophysiological research James A.J. Heathers International Journal of Psychophysiology Volume 89, Issue 3, September 2013, Pages 297–304
The impact of breathing on HRV measurements: Implications for the longitudinal follow-up of athletes. Damien Saboul, Vincent Pialoux & Christophe Hautier. European Journal of Sport Science Volume 13, Issue 5, 2013
Ultra-Short-Term Heart Rate Variability Indexes at Rest and Post-Exercise in Athletes: Evaluating the Agreement with Accepted Recommendations. Michael R. Esco, Andrew A. Flatt Journal of Sports Science and Medicine (2014) 13, 535 – 541
Training Adaptation and Heart Rate Variability in Elite Endurance Athletes: Opening the Door to Effective Monitoring Daniel J. Plews, Paul B. Laursen, Jamie Stanley, Andrew E. Kilding, Martin Buchheit Sports Medicine September 2013, Volume 43, Issue 9, pp 773-781
Autonomic adaptations to intensive and overload training periods: a laboratory study. Vincent Pichot et al, MSSE 2002 DOI: 10.1249/01.MSS.0000035993.08625.31
Evaluating individual training adaptation with Smartphone-derived heart rate variability in a collegiate female soccer team. Flatt, Andrew A.; Esco, Michael R. Journal of Strength & Conditioning Research: Post Acceptance: July 11, 2015 doi: 10.1519/JSC.0000000000001095
Cornforth, D., Campbell, P., Nesbitt, K., Robinson, D. and Jelinek, H.F. (2015) ‘Prediction of game performance in Australian football using heart rate variability measures’, Int. J. Signal and Imaging Systems Engineering, Vol. 8, Nos. 1/2, pp.80–88.
US patent 8666482 Method, system and software product for the measurement of heart rate variability. Simon C Wegerif.


Understand how recovery is measured from HRV but how is energy or activation derived? Training Guide gave me a caution with high HRV and high activation, upper right hand quadrant. How is activation calculated?