By Carl Valle
In this article, we will look at the 100-meter dash as a model for all coaches, not just sprint and hurdle specialists, to understand how analysis drives training. My favorite meeting (track meet for US readers) is the Sundsvall Windprint Grand Prix. Located in a small city in Sweden, this meet provides a complimentary race analysis for all of the sprinting events. During the 100-meter event, for example, the meet organizer, Hakan Andersson, collects the splits of the race with very precise timing. The key race splits are available days after the event, and to me, it is one of the best ways to get an indication of how career development is going. It is essential for coaches wanting to know what happens and how an athlete’s talent develops over time. In this article, the concepts of race analysis and training interventions will be shown in a simple review, allowing coaches and athletes to comprehend how speed must be evaluated properly first, before one can draw conclusions and training changes.

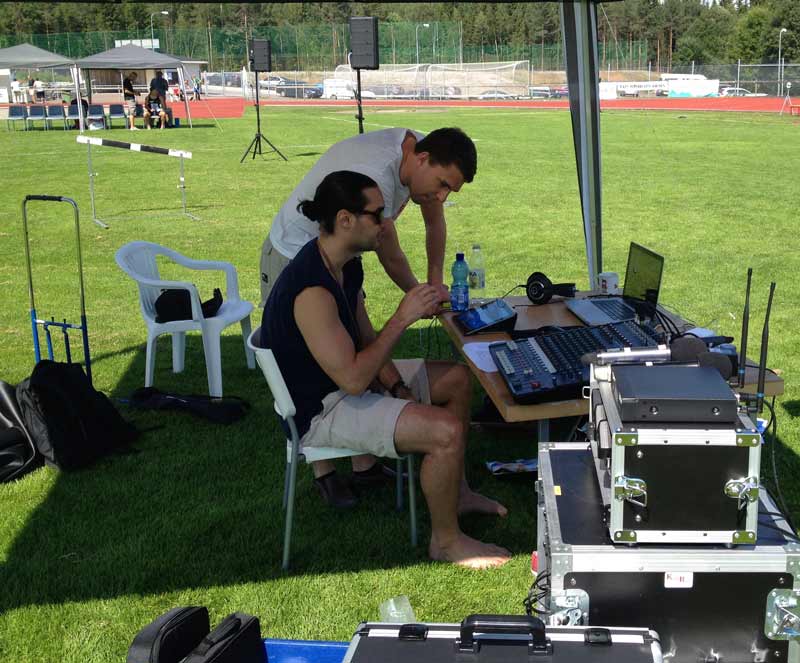
Image 1: Race analysis is not just about looking at biomechanics or 10-meter splits; it’s the entire big picture, including what the DJ is playing. During the heats, D.J. Jens was able to provide some entertainment in the form of Chief Keef, who was requested by one sprinter in the meet.
Breaking Down to Building Up
Many times, the context and specific details are washed away when most races or performances are evaluated; this creates a very limited view of what happened. One expert I always use as a resource for better appreciation of performances is P.J. Vazel, one of the top minds in sprinting. He is a walking encyclopedia of knowledge. He knows the idiosyncrasies of sprinters, their training, and the context of their performances. To look at meets properly, I have been ranking the influence of countless factors that make up a performance. I study the history of the venue, evaluate the weather conditions, investigate the medical status of the athletes competing, and examine the actual race itself. Usually, what I get is a lot of explanations for good and poor performances. These explanations sound like excuses for those not running well, and they sometimes slight great times. It is important for each coach to create a list of what he or she feels is important. The factors mentioned above are likely to be used, as it’s common sense that there are reasons why some races are faster than others. Before a race can be dissected into splits and training plans outlined, it’s wise to create an adjustment table or a list of factors, for a better context. In no way is this list complete, but it’s a fantastic starting place for coaches.
- Weather Conditions – The most obvious information to coaches and what athletes obsess about the most are the weather conditions for the race. Wind, rain, sun, and temperature all play a part in the results. Recording wind readings, temperature, and time of day are essential for the 100-meter dash and other performances and training.
- Competition Quality and Reward – The saying “You are only as good as your enemies” rings true with track and field. When competition quality is high, arousal levels, with corresponding physiological benefits, increase. Money and accolades also increase arousal, and those sometimes have the same effect as competition. Athletes may choke, stay the same, or be encouraged by the great people around them.
- Calendar or Seasonal Period – Athletes need races and time to peak, so comparisons also need to consider when each race is run to ensure that it’s a fair comparison. A college meet in March opening up is dramatically different from one in late August. In addition to time, the number of meets done before the race also matters, but this is also individual.
- Specific Training Program – Different programs work at different times, so while all roads may lead to Rome, some decide to get there at various times. Some programs eliminate indoors altogether, so they are likely thinking of late summer. Some programs require indoors like colleges and those needing indoor appearance fees, so one must look at both the training elements and the splits of the races themselves.
- Venue Dynamics and Crowd – I have a rating system for various meets based on athlete feedback and known objective criteria like track surface, meet promoter, and meet director history, as well as how the crowd is. It is very difficult to get into a meet when it looks like a post-Zombie Plague in the stadium, so sometimes the smaller venues that are full create a better vibe. Another area is how the meet is run, since a good DJ playing some good beats with a short event list can turn an average meet to a rock concert.
- Race Analysis Observation – The indispensable component is looking at the race and talking to the athlete and other competitors. A slow starter, bad timeline, and of course, how the athlete ran are instrumental. Watching the race live and on film can really help spot things. Slow motion is great, but full-speed and near-full-speed playback helps show things that pop out, as slower rates can desensitize analysis.
- Athlete Psychology – The final area that is important is what is between the ears. I have invested most of my last two years with the social and mental aspects of racing because we are getting better insight from research. An athlete going head to head with a guy at 60 meters may cause one to tighten if he thinks he is a “starter,” or it could be a perfect opportunity to put things together when it counts. Again, watching the video and knowing the athlete are essential to interpreting splits because some athletes tend to give up at the end or think they will run down anyone and botch the start.
The final step before looking at the time that is surprising to most is simply looking at the race live and on film. What happened? Too many people start looking at splits and doing analyses without understanding what happened in the race. This was a problem with race data in the past; only the race data is shown, and the video is usually separate from the write-up. There is nothing wrong with the analysis done on paper or an online format, but you must have filmed or at least seen the race. Substituting time sequence data for actual film or visual analysis is not wise for coaches. Physiological and mechanical information from the athlete’s execution influences times, and the key with any information is an interpretation, not just the numbers showing up on the screen or watch. Conversely, the opposite is true with timing; the numbers, if authentic of course, add value to the visual interpretation. A good example is someone attributing a poor time to a bad start when, on film and in splits, the athlete’s entire race was poor, specifically the end. Any athlete who tells me he or she has a bad start is always met with a request for how much time should be taken off his or her time, a reminder that accountability can be appraised as well. When looking at the race, it’s good to see lane assignments and other details as well, since how the athlete is responding to the event and competition matters. While it’s important to run one’s race, the feedback of competitors sometimes will influence the pace or race strategy slightly. Did the athlete give up? In 1998, I was instructed by USATF leader Andrew Roberts on looking for the subtle facial cues during races for deeper analysis. The frown of a sprinter when his lead is cut or passed by hints to a coach that maybe that part of the race was the end to the effort. Many different examples can apply to causes of poor performances: a false or stumble foot strike, a tightening up at the end, rushed steps, an athlete rising early during acceleration, and so on. Sometimes, a performance may be not as good as it appears to be timewise. Surprises to great performances may be due to a wind gage not activated, a flyer, and even an early taper from skipping training or accidental rest. Some visible and less visible causes to races must be factored in, but not over-analyzed.
Case Study- The Windsprint Men’s 100m Final
Sunday’s meet on July 20, 2014, was a great opportunity for athletes to run fast and with numerous personal records; it’s no mystery why the meet is now a staple for many sprinters because of the great conditions. The entire event is about three races. It consists of 100m, 200m, and sprint hurdles. Athletes from all over the world travel to the meet, and with growing prize money and great competition, the meet offers an environment ripe for personal best times.
“The conditions at SSG Wind Sprint was excellent with 25 degrees Celsius and sunshine, perfect for fast running. The fast track in Sundsvall did not make anyone disappointed. With a world-class field of runners like Jaysuma Saidy Ndure and Ezinne Okparaebo, runners with Olympic and world championships merits, the spectators at Baldershovs IP was about to see something special.”
As you can see, the weather was cooperative, the venue was supported by a great crowd, and there were a few sprinters with a history of breaking 10 in various conditions and wind. In the heats, non-invited athletes (those that had to run a qualifier) ran well, some better than others.
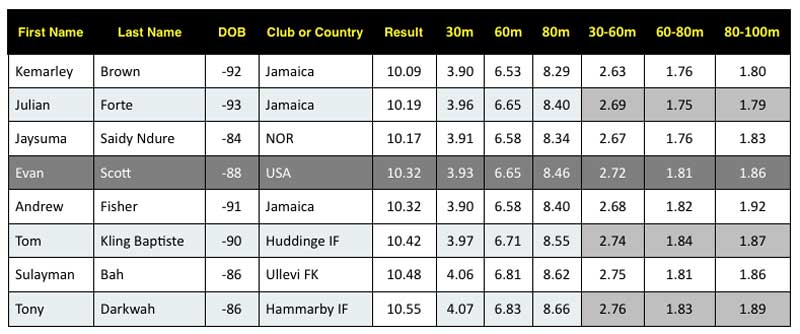
The 100m Final had, of course, a false start by Ndure, but he ran under protest because of the rules allowing one to compete when false start technology is not instantaneous. After a few days of analysis, the splits were created with the hard work of the meet director and his colleague. From the splits, a very detailed picture of the race is available for analysis, and for the purpose and convenience of this article, I will review the third-place athlete Evan Scott of the US.

Chart 1: Windsprint 100m A final with splits for 0-30m, 30-60m, 60m-80m, and 80-100m. Evan Scott is highlighted for detailed analysis in part 1 and projections with future training in part 2.
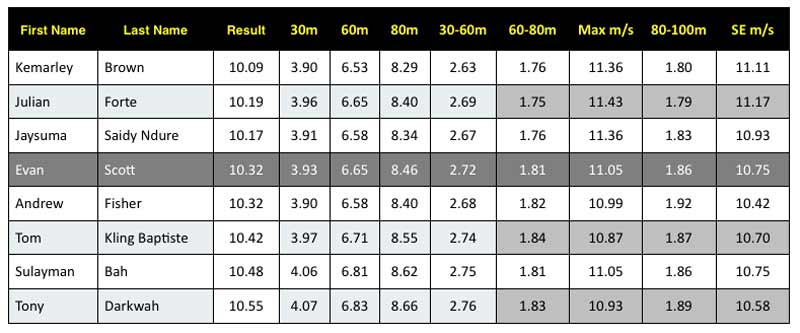
The key takeaway above is that a trend exists with the faster athletes being faster globally. When looking at the top-place finishers, one can be tempted to think that each athlete has a specialty part of the race, but you have to see the video and know the athletes, or context might be lost. With the splits being available, Evan had a complete race with no weak spots, and for him to make a big improvement, he needs to improve his maximal speed by just a percentage point to be not only a top place finisher but also truly world-class. The second chart below has two key new columns, the Max m/s and SE m/s. Max m/s is 60-80m and is an estimated top speed since some athletes may hit top speed at 55-65m, but for the sake of the available data, the range of 60-80 will be used. Speed endurance or the last estimated 20 meters is not perfect, but nearly every race has some decay in velocity from maximal speed, and this race was no exception. Every athlete slowed down at the end of the race, but the most graphic was Andrew Fisher as it cost him money in the end. I don’t know if he was injured, but he lost .06 seconds at 80m, and that difference placed him fourth by the smallest margin (less than .01 seconds).

Chart 2: – Windsprint 100m A final with splits and converted velocities from each segment. Remember that 20m segments may not be accurate enough to show the precise changes during the race, but the splits above are excellent for summarizing abilities.
Splits versus Velocities
The most important concept to understand in this article is the difference between a split and the velocity one is going within the split. In fact, I believe that understanding simple acceleration, maximal or peak velocity, decay of speed, and the distance traveled is the cornerstone to coaching the sprints and power athletes. Experts in GPS and player tracking in Europe are sometimes completely wrong with understanding the chaotic data they are getting with soccer and rugby, and now the NFL and other leagues are tainted. Why? Velocity is instantaneous for the most part in sport, and static averages are fool’s gold. Splits, while not very granular compared to super high-speed film, are extremely useful for evaluating gross athlete development. Also, splits are more practical and more easily implemented into performance. For clarity, defining splits and velocity are as follows:
Split – The subunit of time between two points of the entire locomotive action.
An essential word, it is defined as a subunit, because splits are always a part of a race or performance, not the sum time. When deconstructing performance, one breaks down the race into splits or samples, a quality in training with a split, for the most part. Most splits are organized by using convenient distances, such as 10 meters or 10 yards. Longer distances and longer time ranges are often used.
Velocity – The instantaneous measurement of speed at a given period, moment, or distance.
Velocities are hard to use and are currently bastardized by motion tracking technologies because most data from continual monitoring suffers from the task of reporting in compartmentalized formats like tables. The best example of this is offensive linemen in American Football. They may move explosively and rapidly, but because they may be inert from their competitor, displacement may be essentially zero. Many experienced sports scientists and high-performance advisors know this, but with so many sporting actions being brief, say 2-3 seconds, velocity is hard to use in evaluating speed. NFL teams are foolishly using GPS to monitor practices by looking at peak velocity as an indicator of work being done, thinking that speed and velocity are interchangeable. Examples are running backs who earn their money getting those elusive 5 yards, a distance useless in player tracking because it’s so finite. Fifteen feet seems like a long distance, but timewise, we are talking less than a second, making it too crude for the accuracy of GPS tracking and not effective in looking at effort compared to absolute output. Adding accelerometers does help estimate work, but linear speed is the purest way to gage speed potential.

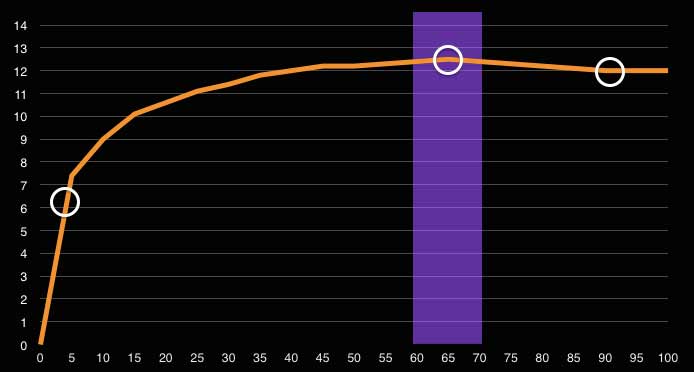
Chart 3: The 2009 100m world record run by Usain Bolt is graphed using distance and velocity. Key milestones in the race are obvious with peak rate of acceleration, max velocity, and deceleration. Using splits at 30, 60, and 80 meters of a 100m dash is valuable, and 10m granularity is more than enough for comprehensive analysis.
Track and field can teach GPS providers a thing or two about velocity and using splits because of the very nature of the sprint events. As each of the 10m segments of time decreases, the average velocity of that specific time frame increases in those zones. What is important to know is that velocities of splits are only averages because each step and within the step is in a constant flux of change in speed. Splits do not tell every detail of every step, just the summaries of the change in general. I use GPS data for the volume and spread (distribution of peak accelerations and peak velocities) of the data and compare them to linear models and lateral deceleration tests.
The question of how splits are useful can be traced to the Usain Bolt article because of the need to get milestones or key areas of speed analysis. After getting the key milestones, splits can be compared and contrasted to other athletes and other races in the past. Splits and velocities can be used to help improve performance from training and testing data by evaluating how sprint events unfold or how sporting actions are affected by fatigue and game situations. To keep things simple, let’s compare two athletes to each other, specifically Evan Scott and the winner Kemarley Brown.
Using Splits to get Faster
The splits of Evan Scott and Kemarley Brown are listed below, along with the differences in time between each segment. While one can compare all-time best performances and even best split performances, the goal of the chart is a working example of how to analyze time better. At first glance, the most obvious difference is 30-60m with nearly a tenth difference compared to a 0.03 difference in the first 30m. Unfortunately, the small difference is likely even smaller as Evan didn’t have a great start and should be under 3.90 seconds next year because of added focus in this area and not having the challenges of training on his own. If Evan improves his 60-80 m segment by just a percentage, his late acceleration will in all probability improve because of his excellent early acceleration. Improving maximal speed by 2-3 percent moves an athlete from qualifying to winning.

Chart 4: Using just a small group of splits starting at 0m and dissecting the speeds at the points of 30m, 60, 80, and 100m give enough information to see where what milestones or areas of speed should be developed and invested into. Note: The splits don’t add up perfectly because they are rounded to the hundredth but are close enough for illustrative purposes.
Just trying to drop .02 seconds per 10m is possible, but fighting over the first 10m is a blind crapshoot, and sometimes, areas of a race are not addressed perfectly. The best direction is to go to the areas that are glaringly weaker and determine why one is underperforming relative to other areas in the race. An athlete will have something to strive for when he or she is compared to the absolute best performer in an array of elite races.
Wrapping up Splits and Velocities
Splits and velocities are individually great, but are far more valuable when used together. Using velocities at the wrong time or using average or peak velocity have their limitations because they don’t tell the whole story, and most of the time, the information is out of context. Analysis should not be done in a vacuum; it should be done in a world that interacts and puts weight on different variables. Obviously, coaches and athletes should not only review each race in some manner, but also focus on the preparation that leads to performance training. Some great talents find ways to get results after the gun is fired, but for the most part, results come from timed workouts that produce a direct cause-and-effect. Training and competition are different, and their reflective velocities need to be collected and analyzed to see how improvement can be made and to determine where an athlete should invest his or her resources specifically. If an athlete has been working for years but has shown no improvement, it could be a sign that he or she is working on the wrong elements. It could also indicate that the athlete can get rid of the blocks with lesser effort. Data does tell a story of timing in speed performances, but the story is better when all parities are on the same page and contribute to the details that matter.
Please share this article so others may benefit.
[mashshare]


Excellent article
thank you very much!
Hi Carl!
Excellent points. Christopher has provided his analysis already but it’s a great time to revisit what he observed when he attended our Carlin Nalley Invitational a couple of years ago and put Freelap watches on the 100 meter dash finalists, with transmitters set to record ten meter segments.
Many runners really enjoyed his presentation, but I was surprised by the number of coaches who didn’t seem all that interested in what the results of those segment splits revealed–high school sprinters actually having two distinct acceleration/deceleration phases.
Great article, very helpful.